The Most Diverse Cities in the United States
The most diverse cities in the U.S.

Photo Credit: Alamy Stock Photo
Diversity has become an increasingly popular issue in media and politics. Crucial to views on immigration and a key issue behind the Black Lives Matter movement, diversity is not only an important social justice issue, but overwhelming evidence shows that diversity fosters a variety of benefits for workplaces, schools, and communities.
Research by McKinsey has shown that a diverse workforce can improve financial performance. Racially diverse schools and classrooms create cognitive, social, and emotional benefits. And living in a diverse community can positively impact an individual’s identity and how they interact with others.
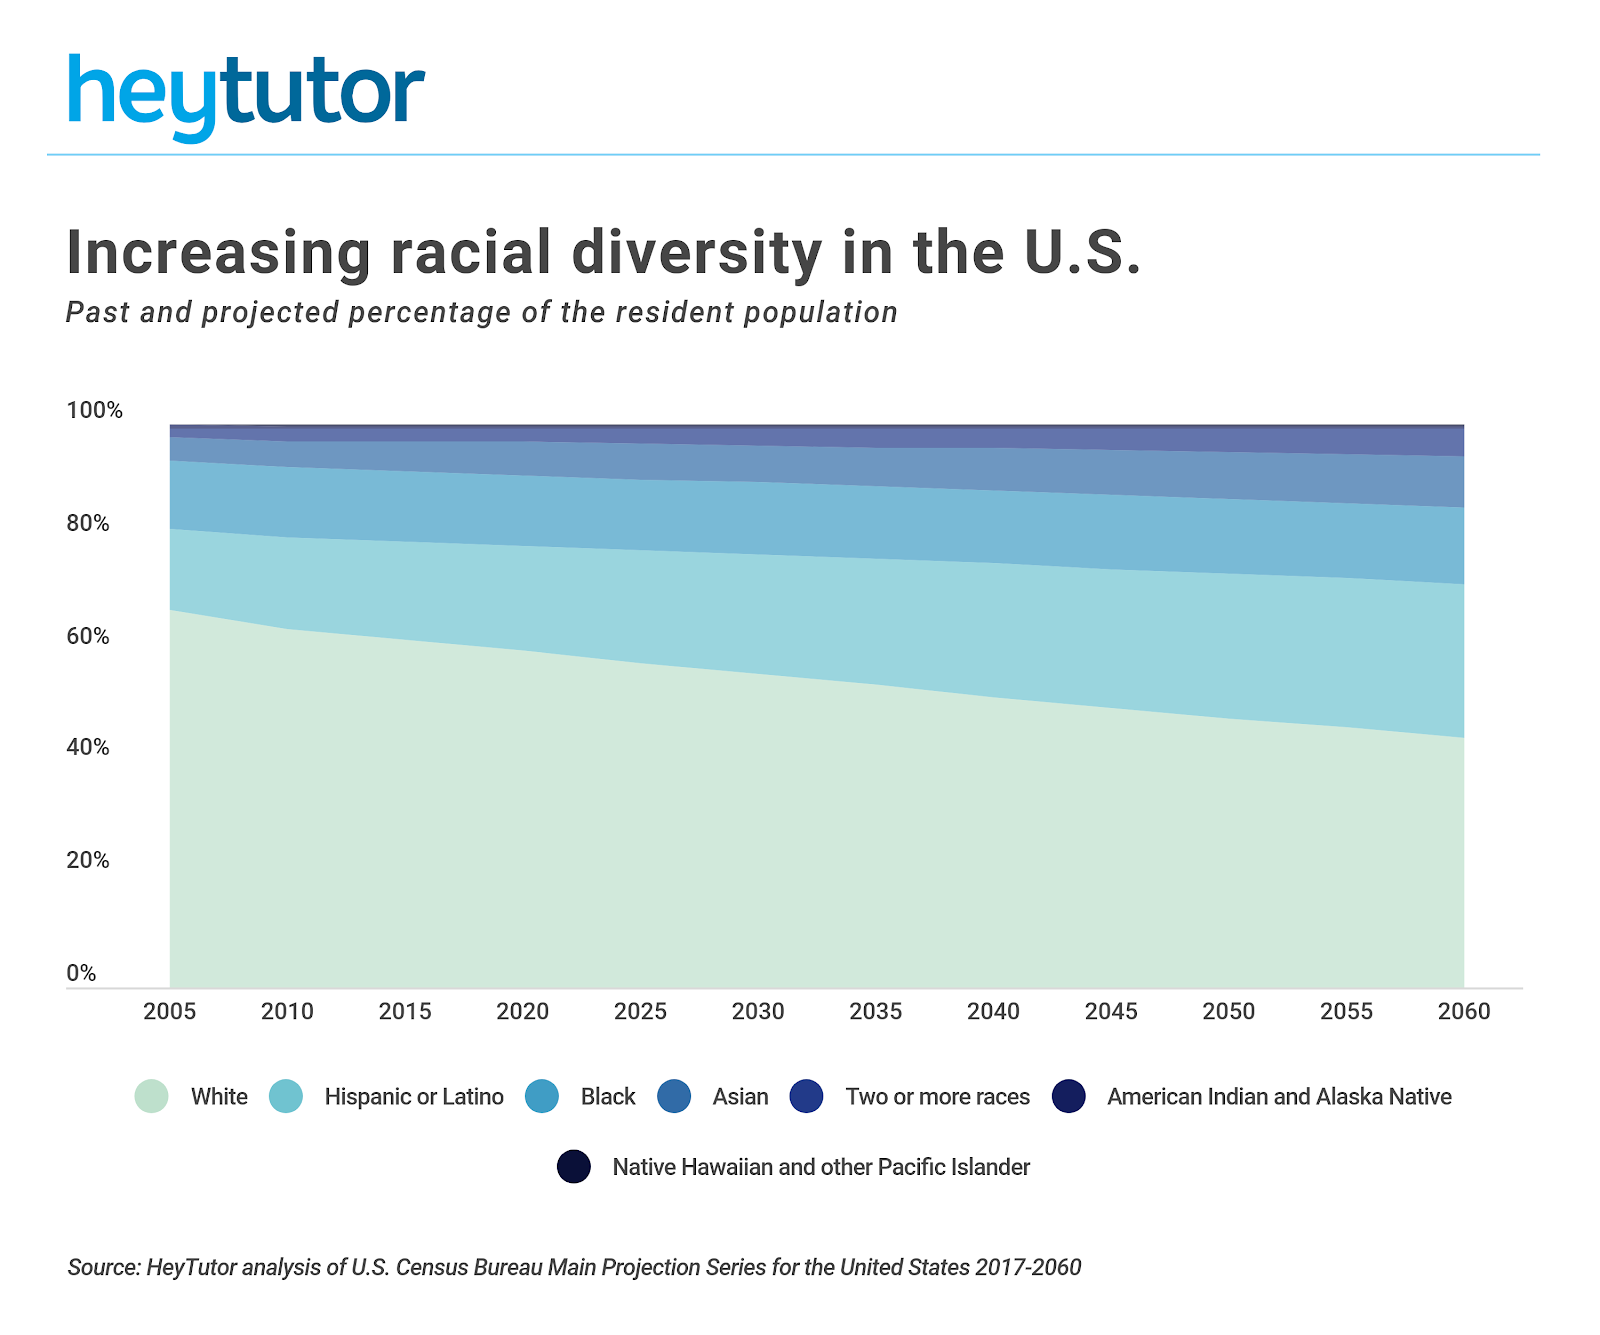
As of 2017, non-Hispanic whites make up 61 percent of the U.S. population. Hispanics/Latinos and blacks account for 18 percent and 12 percent respectively. Asians, American Indians, and other races comprise the remaining 9 percent of the population.
DID YOU KNOW?
Tutoring is a great way to earn cash on the side. HeyTutor has open tutoring jobs near you across dozens of subjects. Contact us today to secure in-home private Math tutoring.
While non-Hispanic whites are still the majority today, this picture is changing as the U.S. is becoming more racially and ethnically diverse. Projections made by the U.S Census Bureau indicate that non-Hispanic whites will make up less than 50 percent of the population by 2045. This demographic milestone will occur even sooner for children under the age of 18, with whites estimated to comprise less than 50 percent of the young population by 2020.
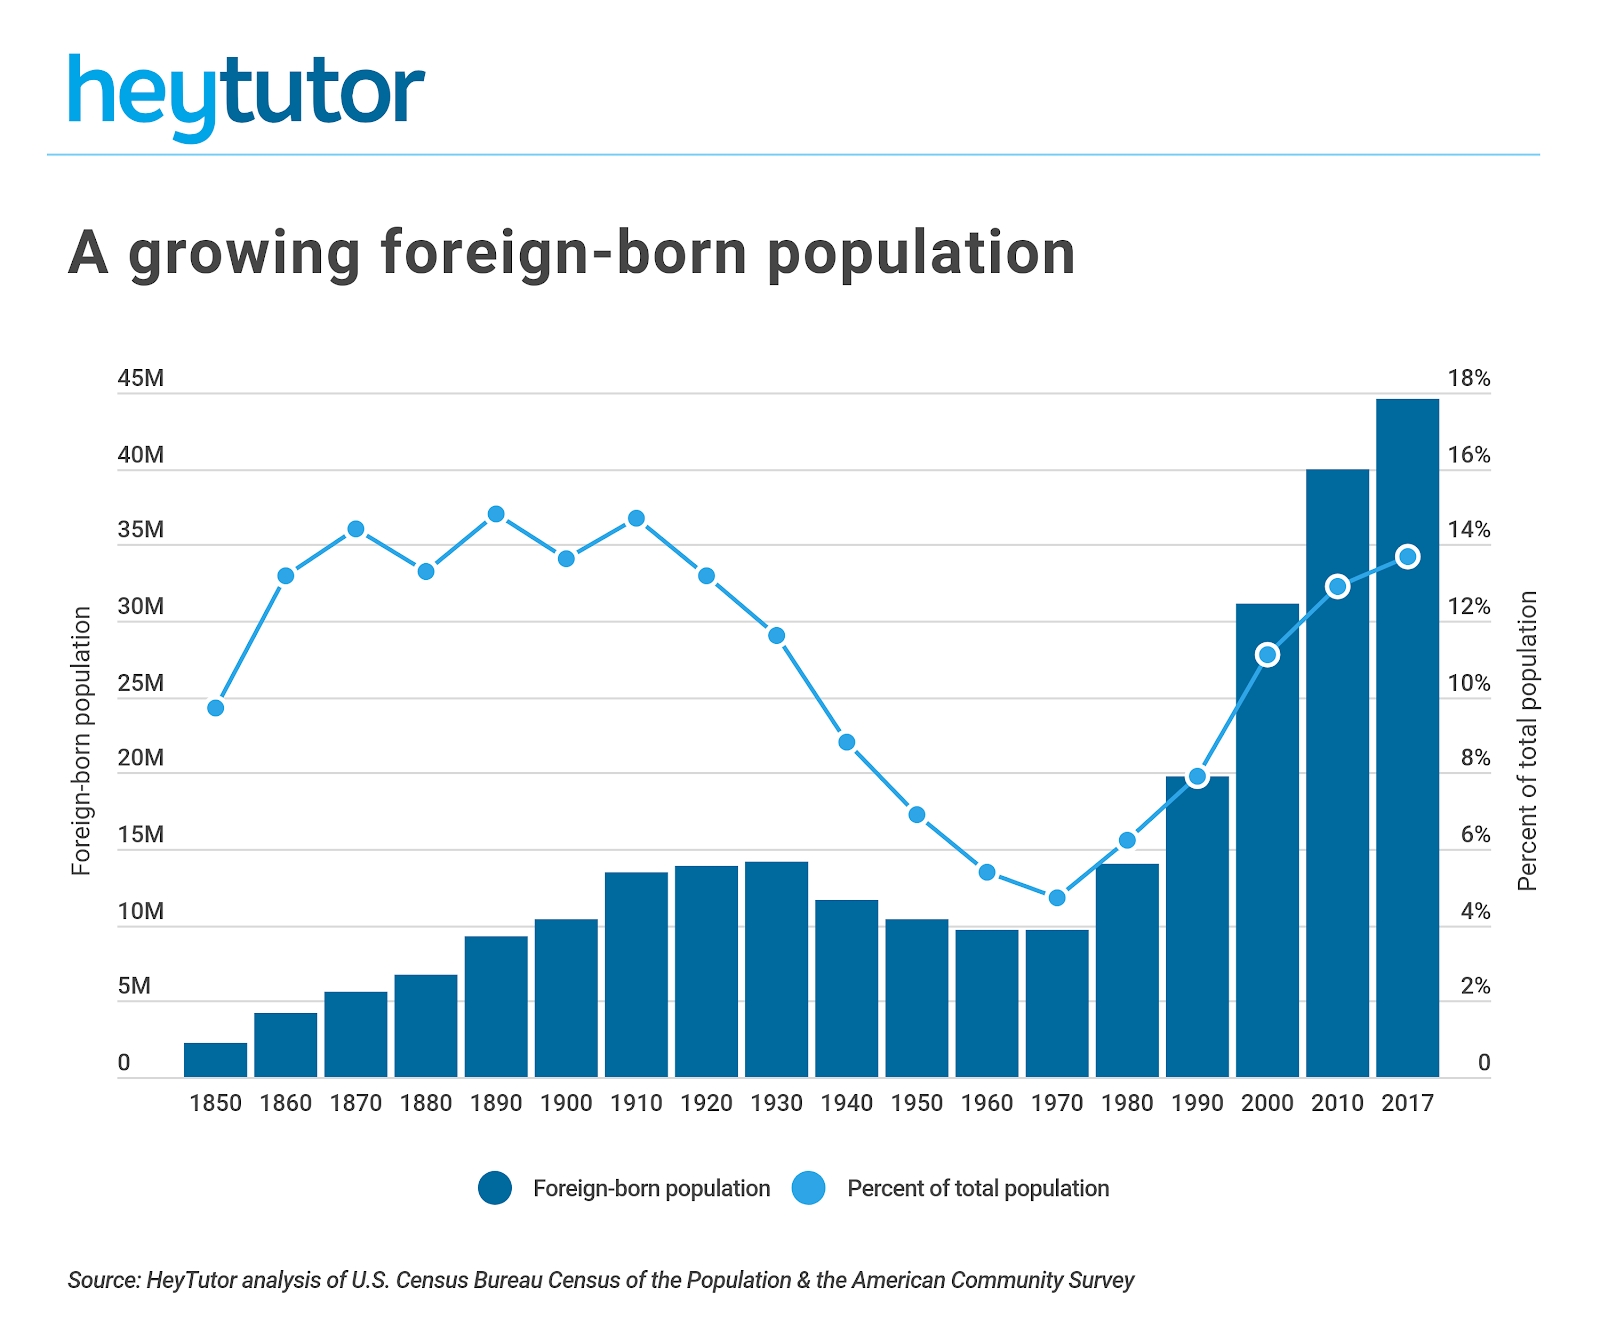
At the same time that America is becoming more racially diverse, the immigrant share of the population is approaching historic highs. Immigrants in the U.S. now account for 13.7 percent of the population, up from a low of 4.7 percent in 1970 but still below the peak of 14.8 percent in 1890. While the U.S. has more total immigrants than any other country in the world, according to Pew Research, America’s foreign-born population as a percentage of total is still modest. For context, 22 percent of people in Canada and 28 percent of people in Australia are foreign born.
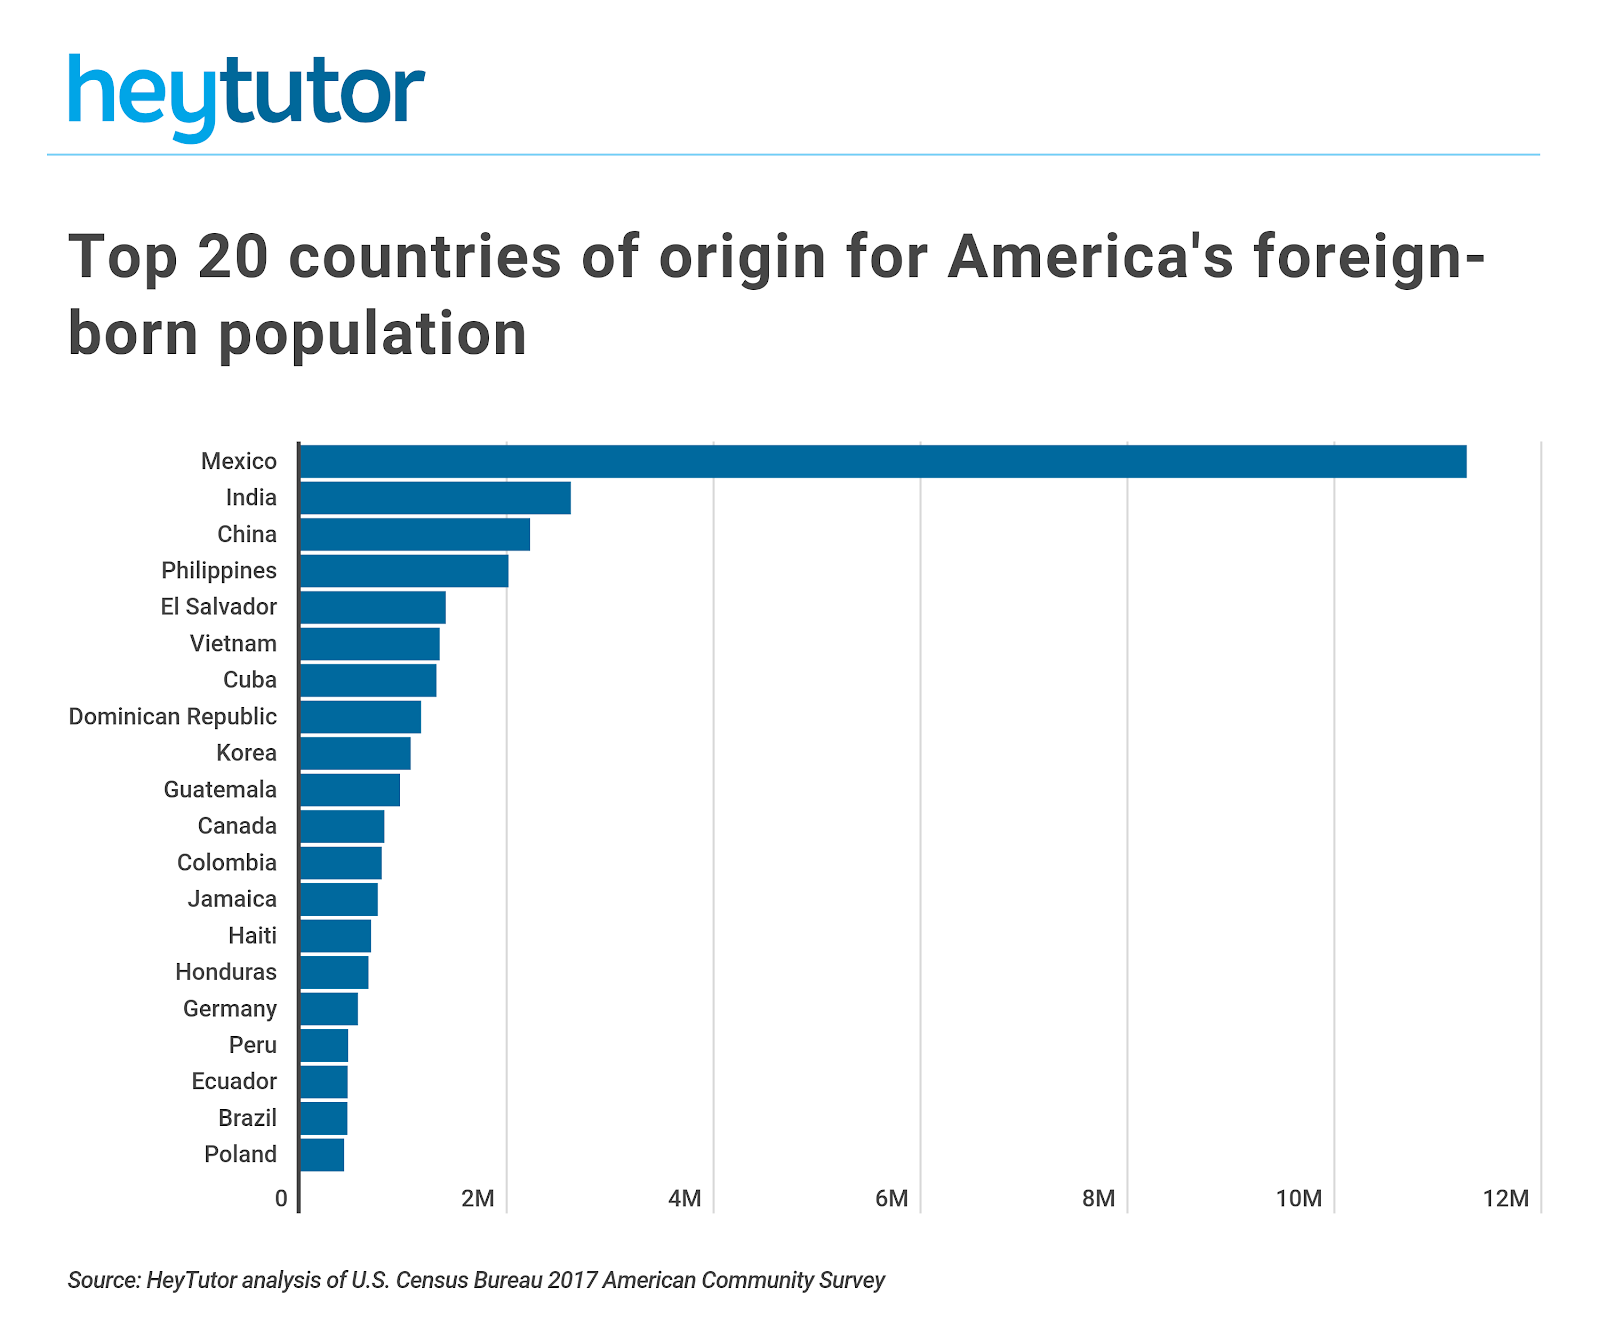
Mexico is the most common country of origin for immigrants to the U.S., followed by India and China. Combined, Latin American and Asian countries account for more than 80 percent of the U.S.’s foreign-born population.
Census Bureau projections also indicate that between 2020 and 2050, the population increase from immigration will outpace that from native births. As the baby boomer generation ages and the fertility rate continues to decline below what’s needed for the population to replace itself, immigration will become the biggest contributor to population growth in the coming years, creating an even more diverse population.
While the trend is clear at a national level, diversity varies widely by location. To find the most diverse cities and states in the U.S., researchers at HeyTutor analyzed the latest data from the U.S. Census Bureau. HeyTutor measured diversity by averaging two separate Simpson Diversity Indexes (one that measures the degree of racial/ethnic diversity and one measuring birthplace diversity). A Simpson Diversity Index can be interpreted as the probability that any resident chosen at random will belong to separate groups.
Key findings
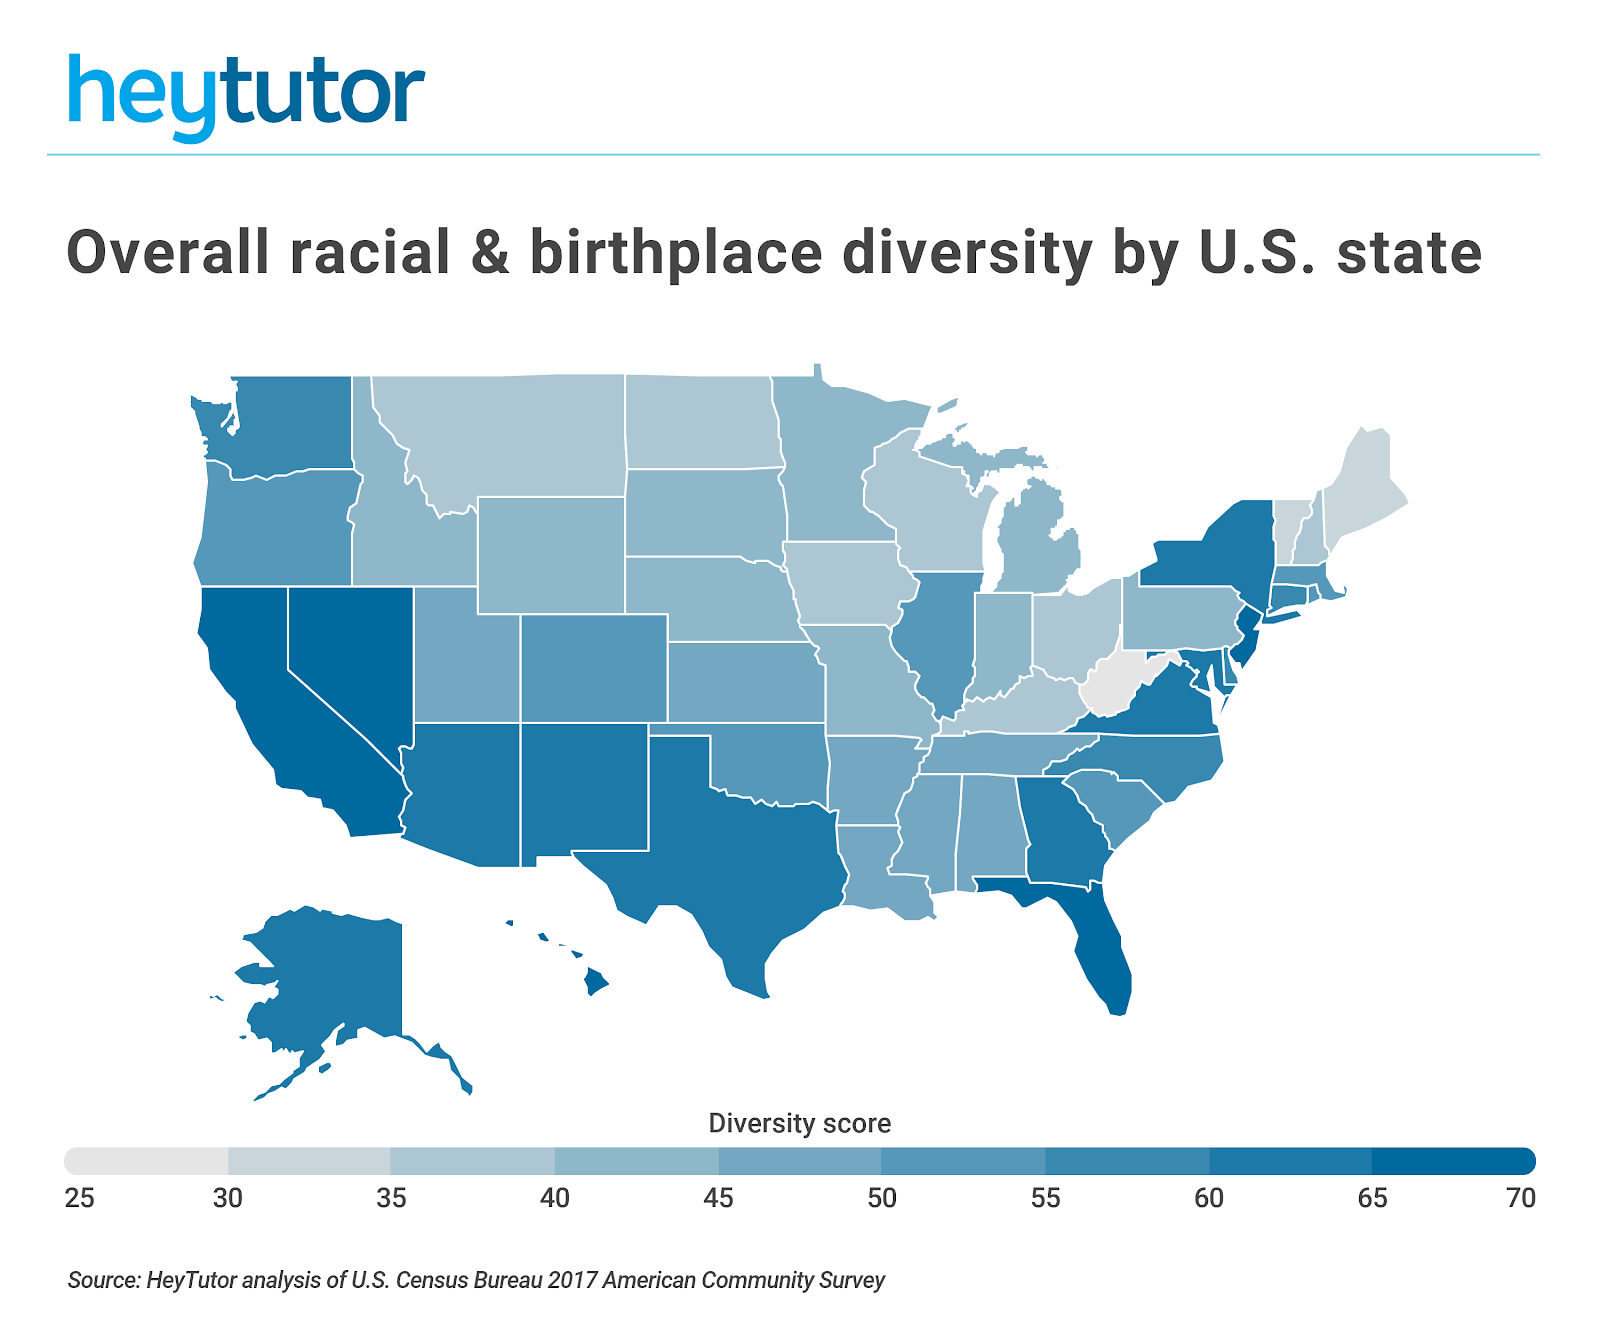
Nationally, both the racial/ethnic diversity index and the birthplace diversity index are 58, creating an overall diversity score of 58 as well. Cities and states with numbers significantly above are more heterogeneous, having stronger representation among different racial and geographic groups. Conversely, areas with numbers significantly below 58 are more homogeneous than the nation as a whole.
At the state level, Hawaii, California, and Florida are the most diverse, while Vermont, Maine, and West Virginia are the least diverse. In general, states on the coasts tend to be more diverse than states in the middle of the country.
States in the U.S. are as different as the cities that comprise them. The data shows that cities within the same state can differ substantially with regard to diversity and that some of the most diverse cities in the U.S. are not found within the most diverse states.
Here are the most diverse small, midsize, and large cities in the U.S.

The most diverse large cities in the U.S.
Photo Credit: Alamy Stock Photo

25. Jacksonville, Florida
Overall diversity score: 62.7
Racial/ethnic diversity index: 63.2
Birthplace diversity index: 62.3
Most common racial/ethnic group: White
Percentage of residents born in state: 48.9%
Percentage of residents foreign born: 12.1%
Most common foreign country of origin: Philippines
TRENDING ON HEYTUTOR
Looking for a tutor? HeyTutor provides access to local tutoring across a range of subjects. Two of our most popular services are math tutoring and physics tutoring.
Photo Credit: Alamy Stock Photo

24. Raleigh, North Carolina
Overall diversity score: 63.1
Racial/ethnic diversity index: 62.7
Birthplace diversity index: 63.5
Most common racial/ethnic group: White
Percentage of residents born in state: 46.5%
Percentage of residents foreign born: 14.0%
Most common foreign country of origin: Mexico
Photo Credit: Alamy Stock Photo

23. Anaheim, California
Overall diversity score: 63.3
Racial/ethnic diversity index: 61.5
Birthplace diversity index: 65.0
Most common racial/ethnic group: Hispanic or Latino
Percentage of residents born in state: 52.5%
Percentage of residents foreign born: 37.1%
Most common foreign country of origin: Mexico
Photo Credit: Alamy Stock Photo

22. Austin, Texas
Overall diversity score: 64.0
Racial/ethnic diversity index: 64.4
Birthplace diversity index: 63.7
Most common racial/ethnic group: White
Percentage of residents born in state: 52.8%
Percentage of residents foreign born: 18.7%
Most common foreign country of origin: Mexico
Photo Credit: Alamy Stock Photo

21. Fort Worth, Texas
Overall diversity score: 64.4
Racial/ethnic diversity index: 68.1
Birthplace diversity index: 60.7
Most common racial/ethnic group: White
Percentage of residents born in state: 56.0%
Percentage of residents foreign born: 18.0%
Most common foreign country of origin: Mexico
Photo Credit: Alamy Stock Photo

20. Washington, District of Columbia
Overall diversity score: 64.6
Racial/ethnic diversity index: 64.7
Birthplace diversity index: 64.5
Most common racial/ethnic group: Black
Percentage of residents born in state: 37.4%
Percentage of residents foreign born: 14.7%
Most common foreign country of origin: El Salvador
Photo Credit: Alamy Stock Photo

19. Phoenix, Arizona
Overall diversity score: 64.9
Racial/ethnic diversity index: 63.4
Birthplace diversity index: 66.4
Most common racial/ethnic group: Hispanic or Latino
Percentage of residents born in state: 42.8%
Percentage of residents foreign born: 19.3%
Most common foreign country of origin: Mexico
Photo Credit: Alamy Stock Photo

18. Long Beach, California
Overall diversity score: 65.6
Racial/ethnic diversity index: 70.1
Birthplace diversity index: 61.1
Most common racial/ethnic group: Hispanic or Latino
Percentage of residents born in state: 57.9%
Percentage of residents foreign born: 25.4%
Most common foreign country of origin: Mexico
Photo Credit: Alamy Stock Photo
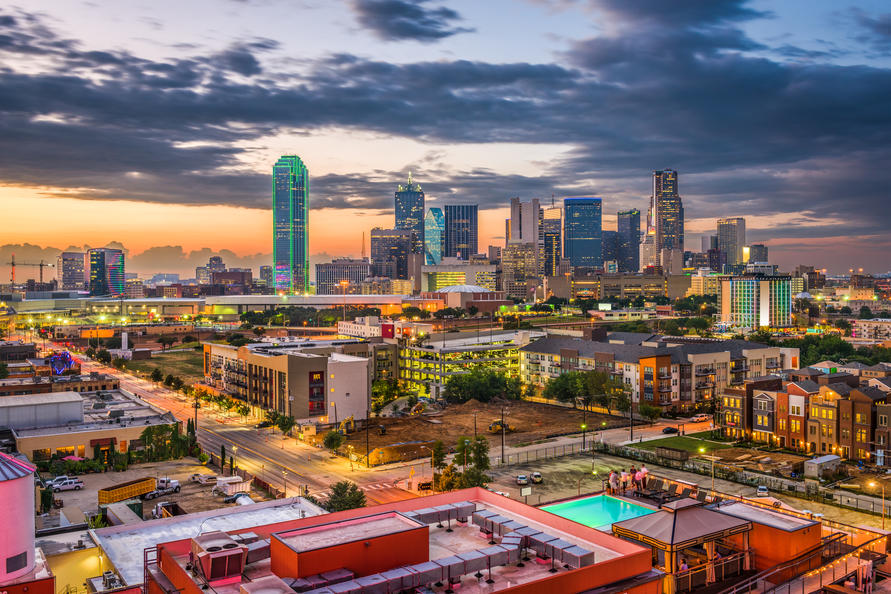
17. Dallas, Texas
Overall diversity score: 65.8
Racial/ethnic diversity index: 68.5
Birthplace diversity index: 63.0
Most common racial/ethnic group: Hispanic or Latino
Percentage of residents born in state: 54.3%
Percentage of residents foreign born: 24.9%
Most common foreign country of origin: Mexico
Photo Credit: Alamy Stock Photo
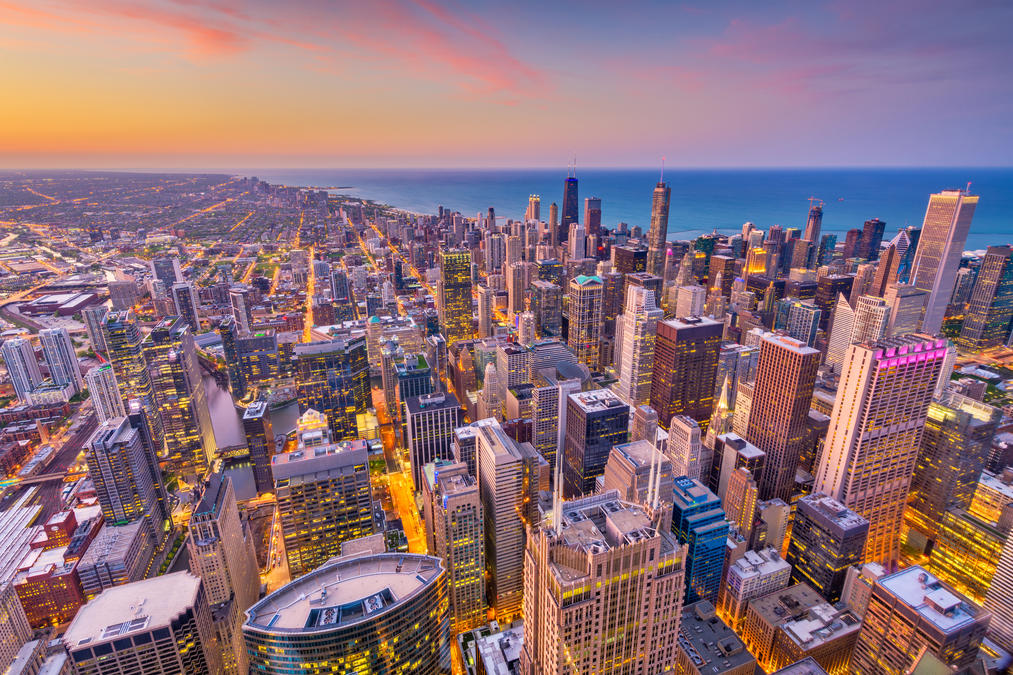
16. Chicago, Illinois
Overall diversity score: 65.8
Racial/ethnic diversity index: 71.7
Birthplace diversity index: 59.9
Most common racial/ethnic group: White
Percentage of residents born in state: 59.5%
Percentage of residents foreign born: 20.8%
Most common foreign country of origin: Mexico
Photo Credit: Alamy Stock Photo

15. Honolulu, Hawaii
Overall diversity score: 66.0
Racial/ethnic diversity index: 65.3
Birthplace diversity index: 66.7
Most common racial/ethnic group: Asian
Percentage of residents born in state: 48.4%
Percentage of residents foreign born: 27.5%
Most common foreign country of origin: Philippines
DID YOU KNOW?
Even the best students can benefit from working with a tutor. English tutoring and calculus tutoring are two of our most popular subjects. We also have tutoring positions available for qualified candidates.
Photo Credit: Alamy Stock Photo

14. Las Vegas, Nevada
Overall diversity score: 66.5
Racial/ethnic diversity index: 67.6
Birthplace diversity index: 65.3
Most common racial/ethnic group: White
Percentage of residents born in state: 25.6%
Percentage of residents foreign born: 21.8%
Most common foreign country of origin: Mexico
Photo Credit: Alamy Stock Photo

13. Houston, Texas
Overall diversity score: 66.8
Racial/ethnic diversity index: 68.5
Birthplace diversity index: 65.2
Most common racial/ethnic group: Hispanic or Latino
Percentage of residents born in state: 52.4%
Percentage of residents foreign born: 29.1%
Most common foreign country of origin: Mexico
Photo Credit: Alamy Stock Photo

12. Charlotte, North Carolina
Overall diversity score: 67.0
Racial/ethnic diversity index: 68.3
Birthplace diversity index: 65.7
Most common racial/ethnic group: White
Percentage of residents born in state: 41.2%
Percentage of residents foreign born: 17.1%
Most common foreign country of origin: Mexico
Photo Credit: Alamy Stock Photo

11. Los Angeles, California
Overall diversity score: 67.8
Racial/ethnic diversity index: 66.0
Birthplace diversity index: 69.6
Most common racial/ethnic group: Hispanic or Latino
Percentage of residents born in state: 46.8%
Percentage of residents foreign born: 36.9%
Most common foreign country of origin: Mexico
Photo Credit: Alamy Stock Photo

10. Tampa, Florida
Overall diversity score: 67.9
Racial/ethnic diversity index: 67.9
Birthplace diversity index: 68.0
Most common racial/ethnic group: White
Percentage of residents born in state: 41.0%
Percentage of residents foreign born: 17.7%
Most common foreign country of origin: Cuba
Photo Credit: Alamy Stock Photo

9. Sacramento, California
Overall diversity score: 68.0
Racial/ethnic diversity index: 76.4
Birthplace diversity index: 59.6
Most common racial/ethnic group: White
Percentage of residents born in state: 59.9%
Percentage of residents foreign born: 22.3%
Most common foreign country of origin: Mexico
Photo Credit: Alamy Stock Photo

8. Arlington, Texas
Overall diversity score: 68.2
Racial/ethnic diversity index: 71.2
Birthplace diversity index: 65.3
Most common racial/ethnic group: White
Percentage of residents born in state: 52.2%
Percentage of residents foreign born: 22.7%
Most common foreign country of origin: Mexico
Photo Credit: Alamy Stock Photo

7. Aurora, Colorado
Overall diversity score: 69.5
Racial/ethnic diversity index: 69.3
Birthplace diversity index: 69.7
Most common racial/ethnic group: White
Percentage of residents born in state: 40.0%
Percentage of residents foreign born: 22.9%
Most common foreign country of origin: Mexico
Photo Credit: Alamy Stock Photo
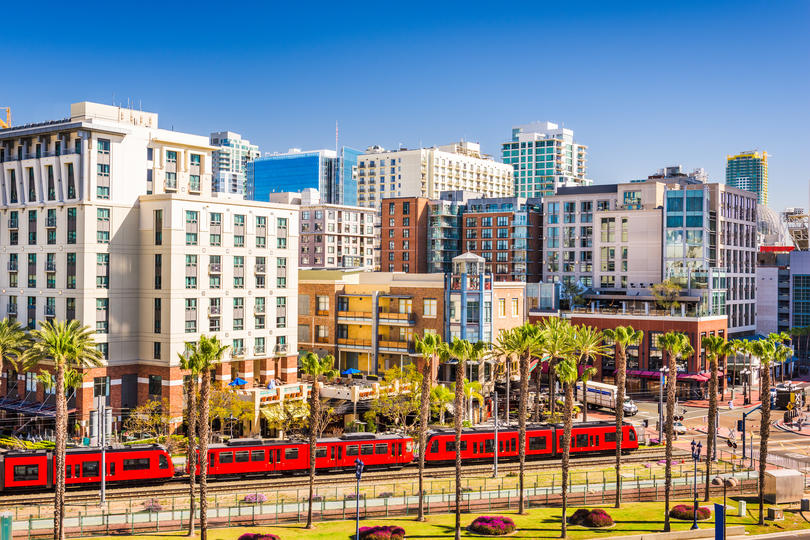
6. San Diego, California
Overall diversity score: 69.5
Racial/ethnic diversity index: 69.5
Birthplace diversity index: 69.5
Most common racial/ethnic group: White
Percentage of residents born in state: 46.4%
Percentage of residents foreign born: 25.9%
Most common foreign country of origin: Mexico
Photo Credit: Alamy Stock Photo
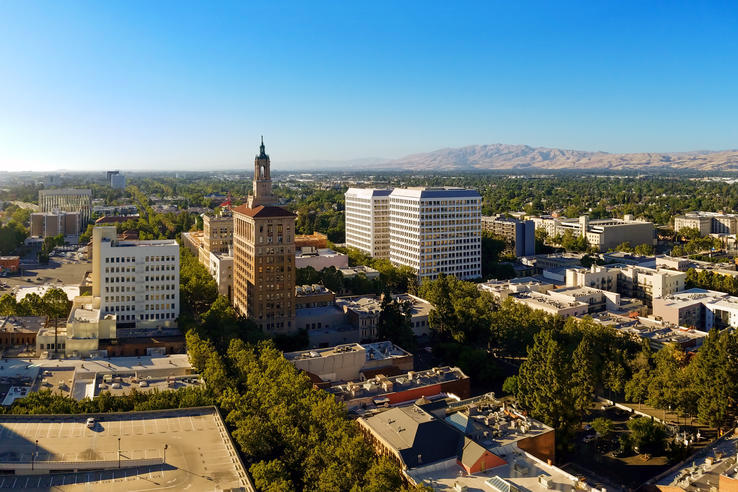
5. San Jose, California
Overall diversity score: 69.8
Racial/ethnic diversity index: 70.3
Birthplace diversity index: 69.2
Most common racial/ethnic group: Asian
Percentage of residents born in state: 46.6%
Percentage of residents foreign born: 40.3%
Most common foreign country of origin: Mexico
TRENDING ON HEYTUTOR
Applying to college this year? Work with one of our SAT tutors to get ready for test day.
Photo Credit: Alamy Stock Photo
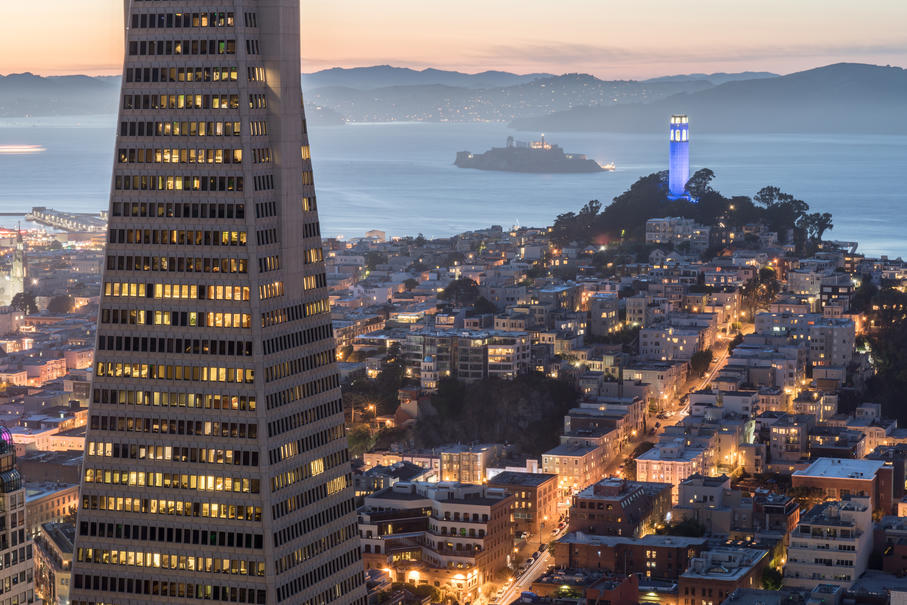
4. San Francisco, California
Overall diversity score: 71.4
Racial/ethnic diversity index: 69.3
Birthplace diversity index: 73.4
Most common racial/ethnic group: White
Percentage of residents born in state: 38.9%
Percentage of residents foreign born: 35.6%
Most common foreign country of origin: China, excluding Hong Kong and Taiwan
Photo Credit: Alamy Stock Photo
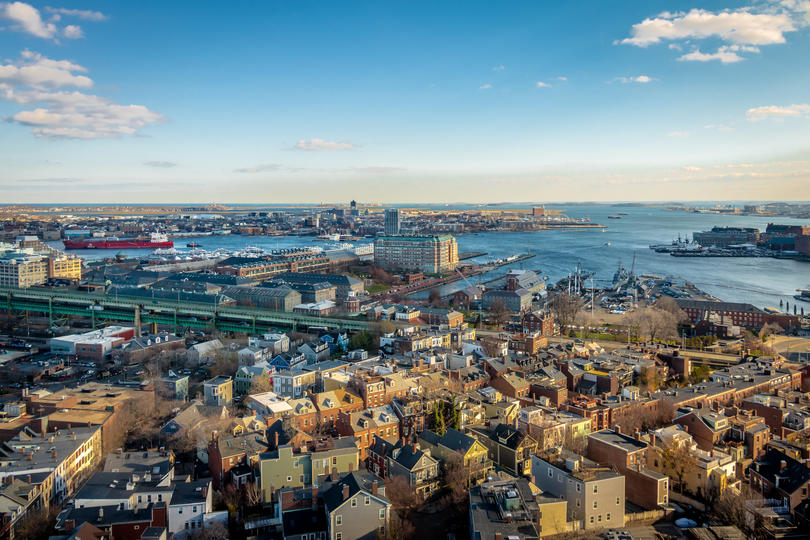
3. Boston, Massachusetts
Overall diversity score: 71.6
Racial/ethnic diversity index: 70.2
Birthplace diversity index: 73.1
Most common racial/ethnic group: White
Percentage of residents born in state: 43.3%
Percentage of residents foreign born: 29.3%
Most common foreign country of origin: Dominican Republic
Photo Credit: Alamy Stock Photo

2. Oakland, California
Overall diversity score: 72.4
Racial/ethnic diversity index: 76.7
Birthplace diversity index: 68.0
Most common racial/ethnic group: Hispanic or Latino
Percentage of residents born in state: 49.5%
Percentage of residents foreign born: 28.1%
Most common foreign country of origin: Mexico
Photo Credit: Alamy Stock Photo

1. New York, New York
Overall diversity score: 72.5
Racial/ethnic diversity index: 74.6
Birthplace diversity index: 70.4
Most common racial/ethnic group: White
Percentage of residents born in state: 48.4%
Percentage of residents foreign born: 37.1%
Most common foreign country of origin: Dominican Republic
Methodology & full results
Current racial/ethnicity and birthplace statistics are from the U.S. Census Bureau’s 2017 American Community Survey 1-Year Estimates. Historical racial/ethnicity statistics come from the 2005 - 2016 American Community Survey 1-Year Estimates. Projected racial/ethnicity statistics are sourced from Census Bureau’s 2017 National Population Projection tables.
For each city, an overall diversity score was calculated using the average of two diversity indexes, one measuring racial/ethnic diversity and one measuring birthplace diversity of both the native-born and foreign-born population. Each of these diversity indexes is a Simpson Diversity Index that can be interpreted as the probability that any resident of a city chosen at random will belong to separate racial/ethnic or birthplace groups.
The categories used in the racial/ethnic diversity index are:
Non-hispanic White alone
Non-hispanic Black or African American alone
Non-hispanic American Indian and Alaska Native alone
Non-hispanic Asian alone
Non-hispanic Native Hawaiian and Other Pacific Islander alone
Non-hispanic Some other race alone
Non-hispanic Two or more races
Hispanic or Latino
The categories used in the birthplace index are:
Born in state of residence
Born out of state
Foreign born - Europe
Foreign born - Asia
Foreign born - Africa
Foreign born - Oceania
Foreign born - Latin America
Foreign born - Northern America
Cites were grouped into the following categories based on population size:
Large: Cities with more than 350,000 people
Midize: Cities with 150,000 - 350,000 people
Small: Cities with 100,000 - 150,000 people

