
22 Apr States Investing the Most in Higher Education

Photo Credit: Glenn Nagel / Alamy Stock Photo
Education is one of the most important factors when it comes to improving one’s career options and economic opportunities. Despite small fluctuations over the past few years, enrollment in higher education is at its highest level in history. With roughly three out of four undergraduates enrolled in a public university, investment in public higher education, in particular, plays a vital role in shaping our nation’s social and economic future.
Although one of the draws of public higher education is affordability, a combination of rising prices and stagnant wages are leaving many students with decades of loan payments following graduation. Experts attribute rising tuition, in large part, to an overall decline in state and local funding for higher education over the past 25 years, and especially since the Great Recession.
“If the state appropriation is cut, schools face a hard choice. They can raise tuition to preserve quality, trim spending despite the negative effects this may have on student learning as well as on retention and graduation rates, or limit admissions slots,” explained the American Council on Education in its report The Anatomy of College Tuition.
Across both public and private institutions, higher education has always been a highly subsidized activity. Whether these subsidies come in the form of endowment earnings, donations, grants, or government appropriations, they allow most students to pay much less than the full cost of their education—even those paying full tuition. When subsidies are cut, the share of the cost burden is shifted from the states to the students and their families.
TRENDING ON HEYTUTOR
Does your child need a math tutor? Our team of math experts is here to help. All of our online tutors are college educated. Many are former math teachers. Other than Math, we also offer private Science tutors, local English tutors, and top quality Spanish tutors!
How is public higher education funded?
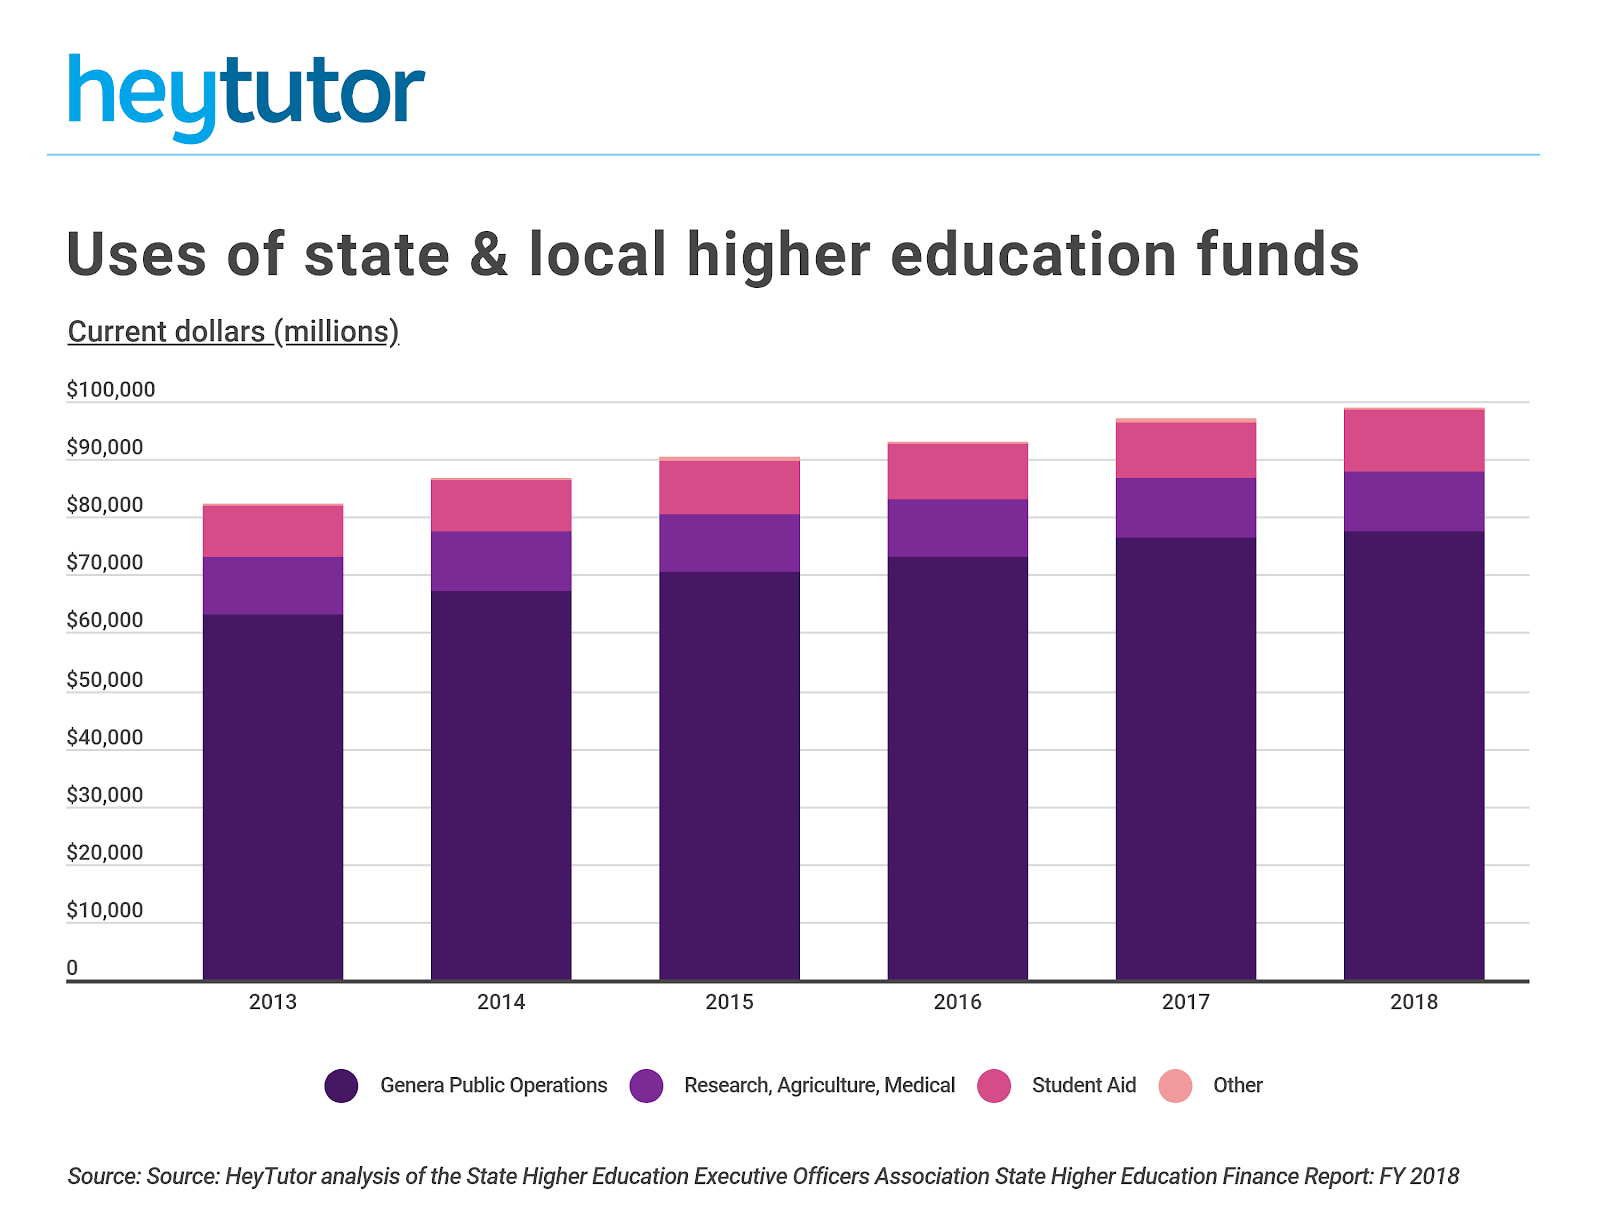
Higher education at public universities is funded through a combination of tuition revenue and state and local support (also known as appropriations). State and local revenue sources include taxes, lottery revenue, mineral and resource extraction revenue, and state-funded endowments. These funds are used to support several initiatives including general operations, student aid, research, agricultural-related programs, and medical education, among others.
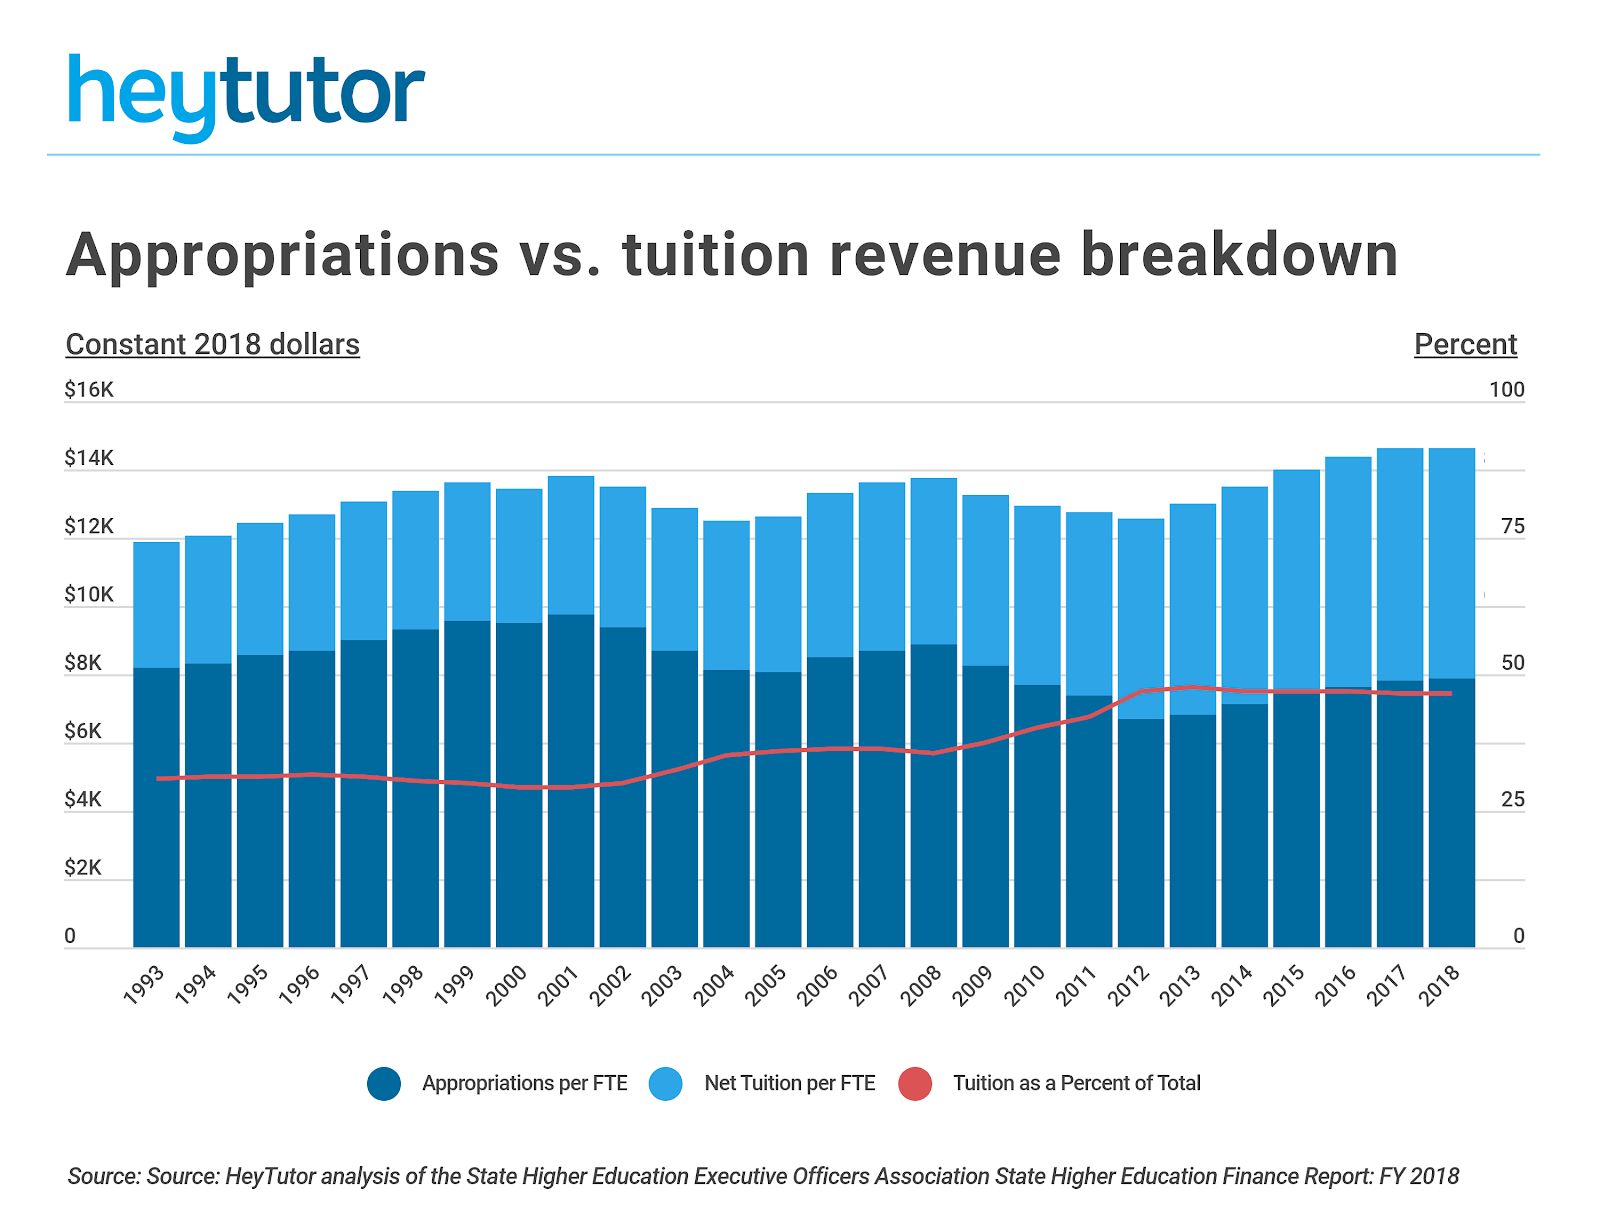
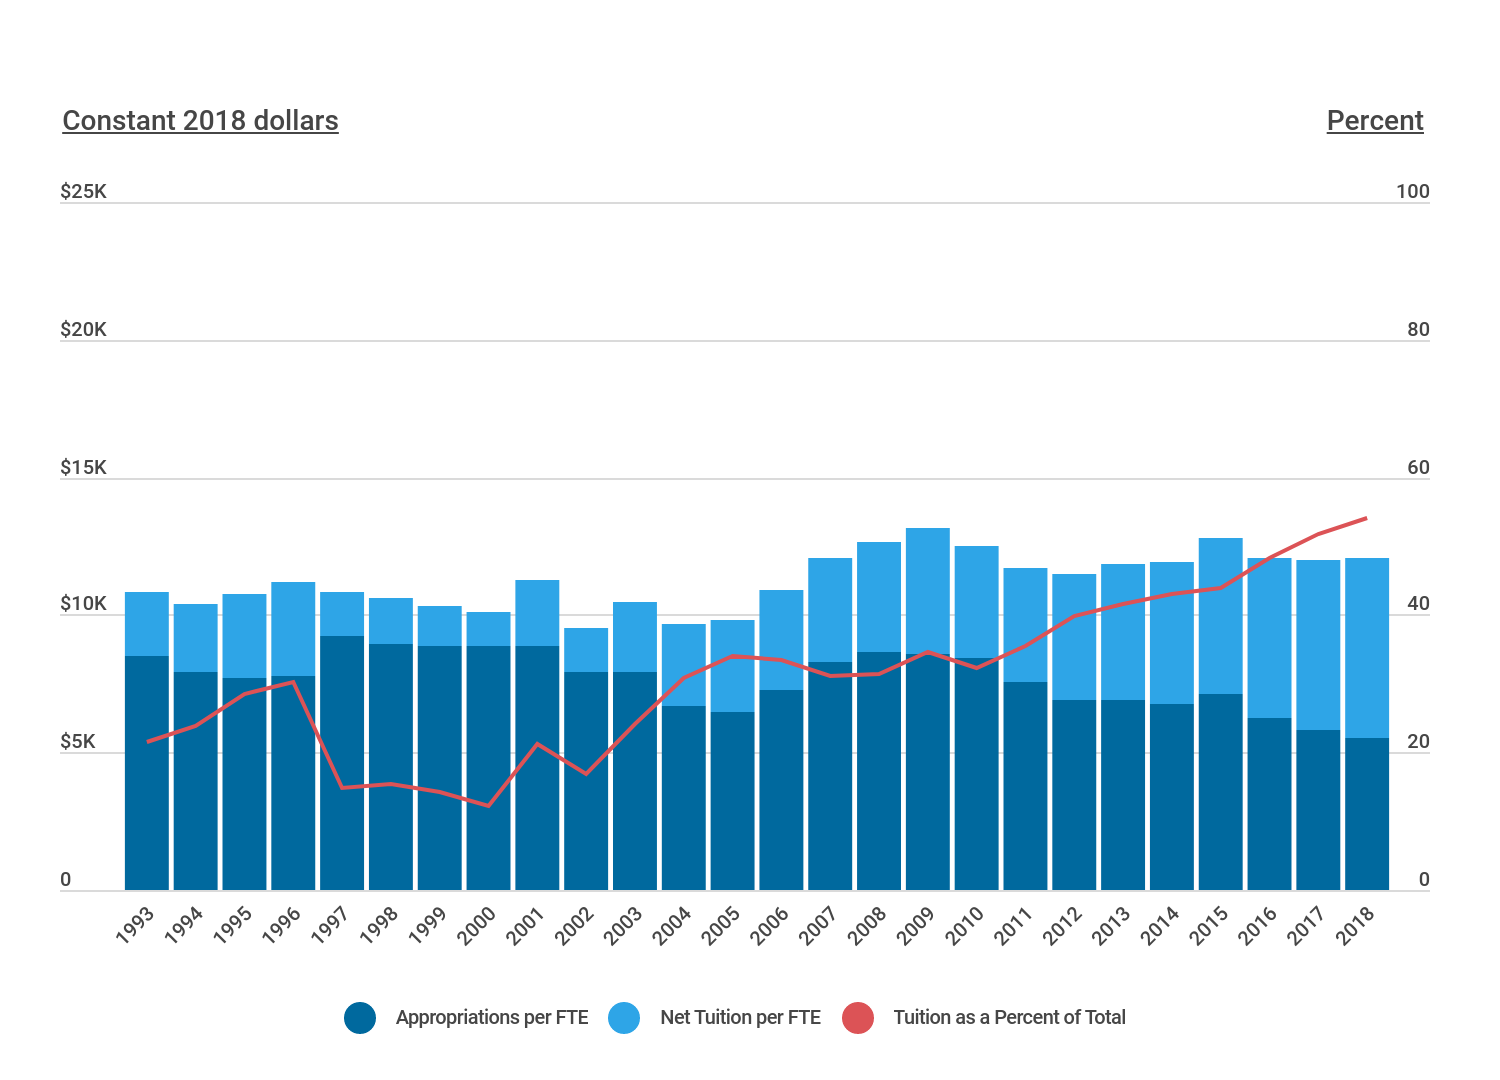
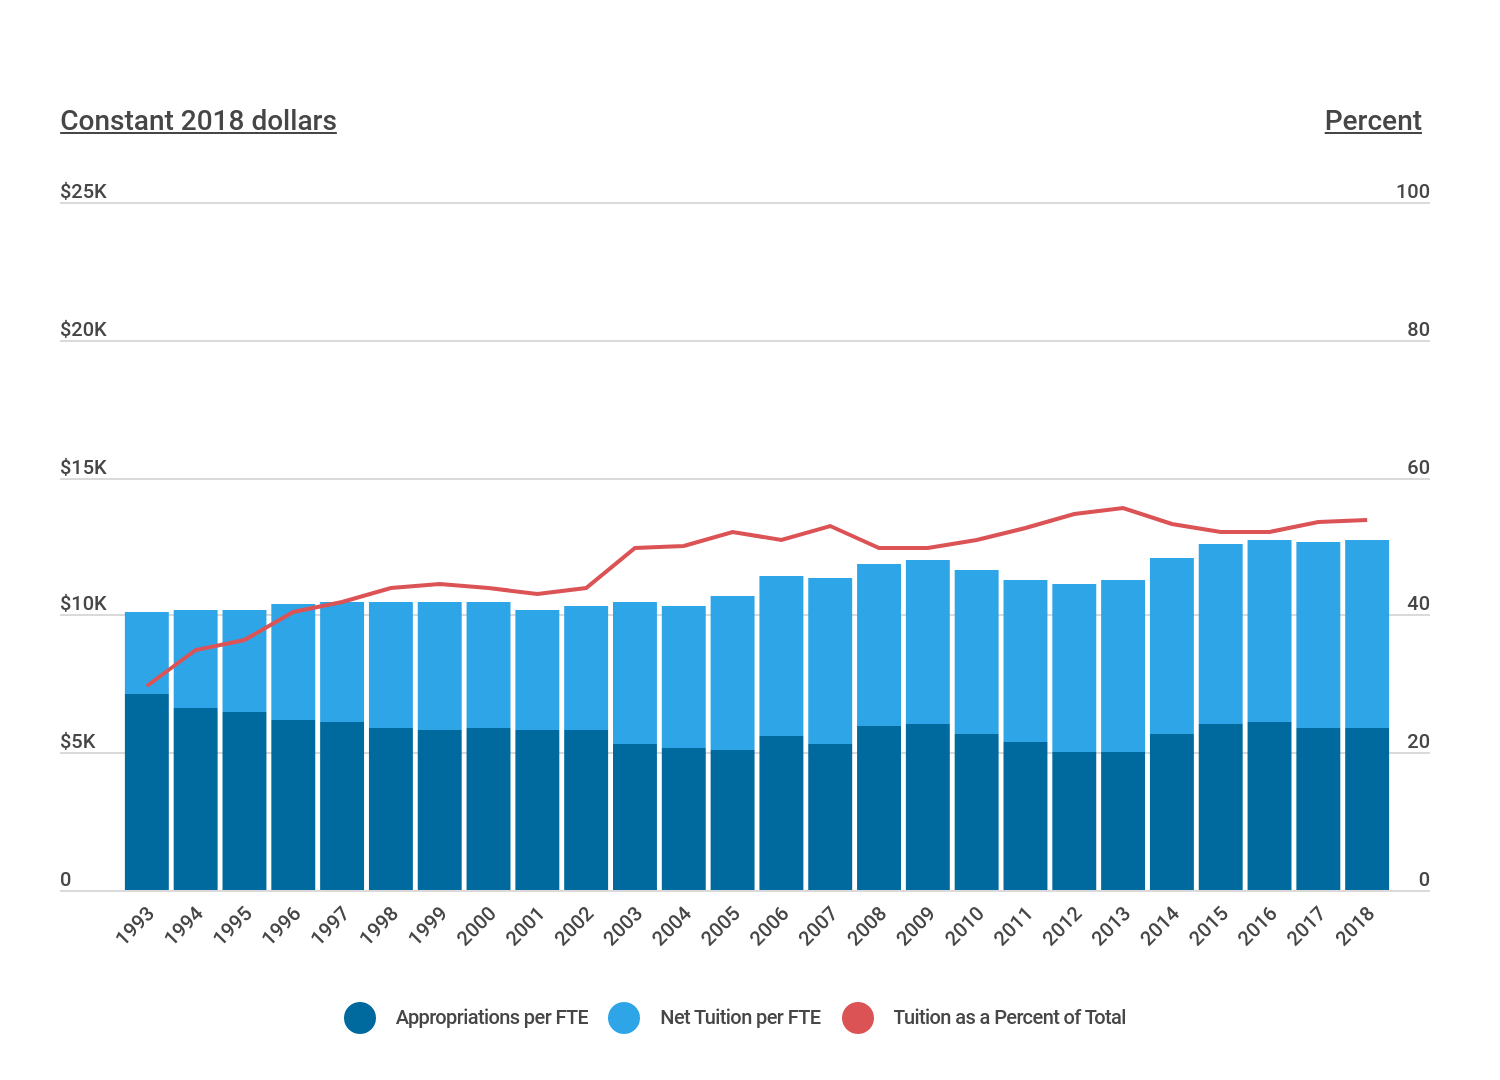
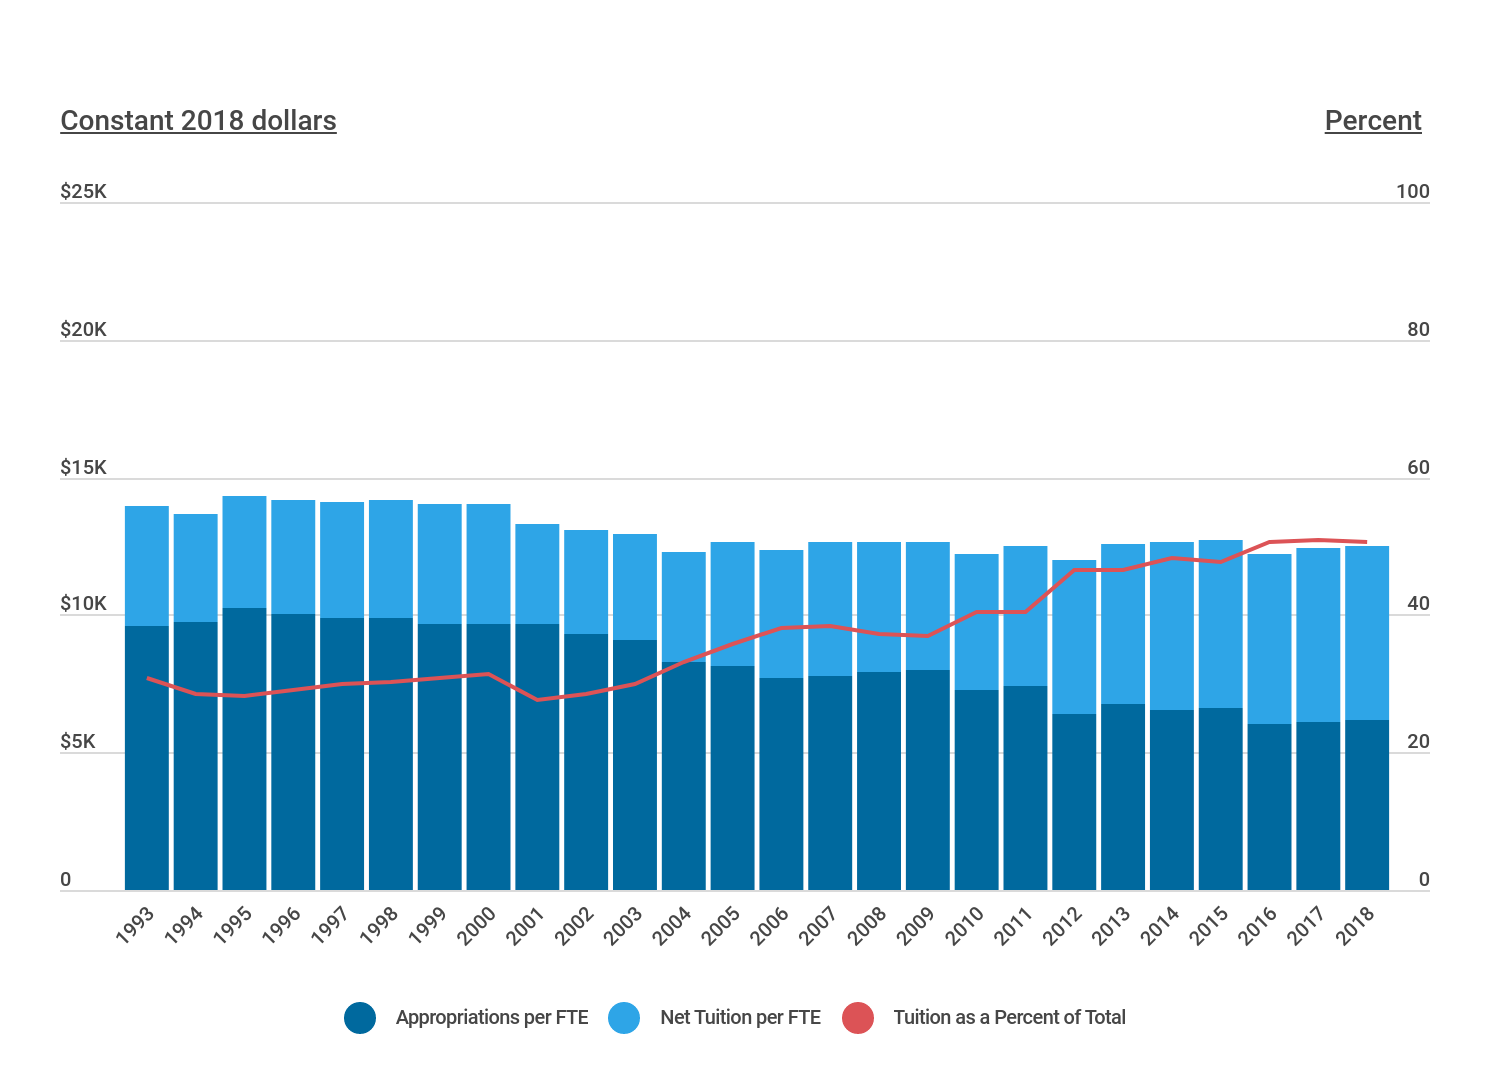
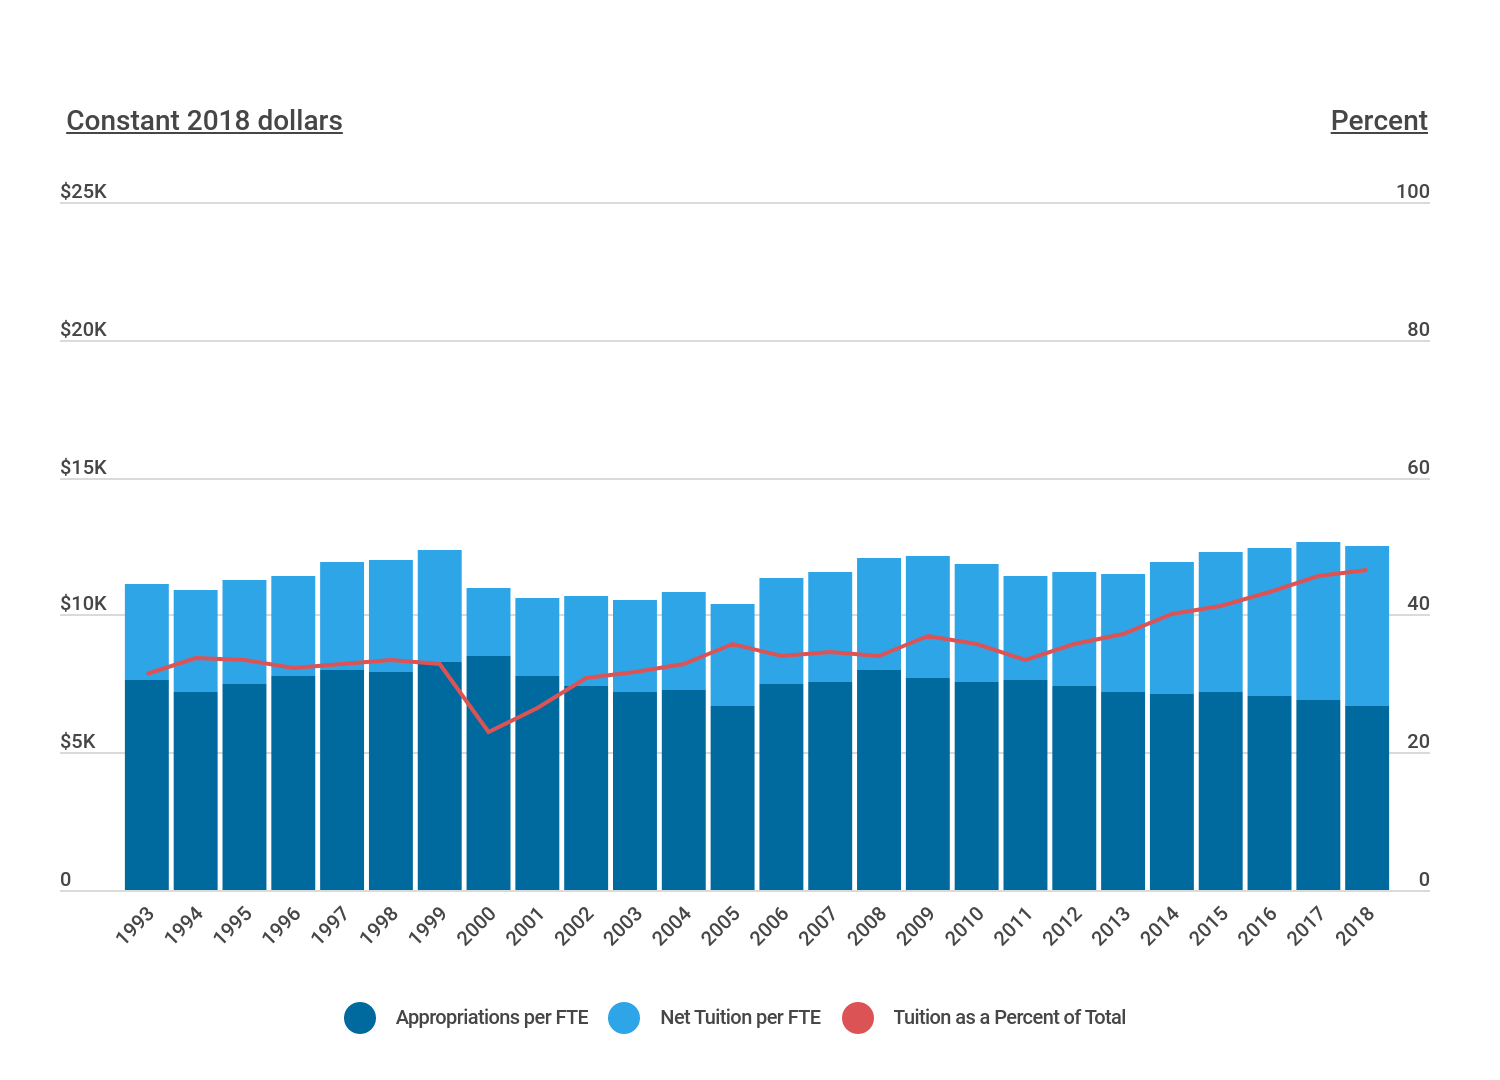
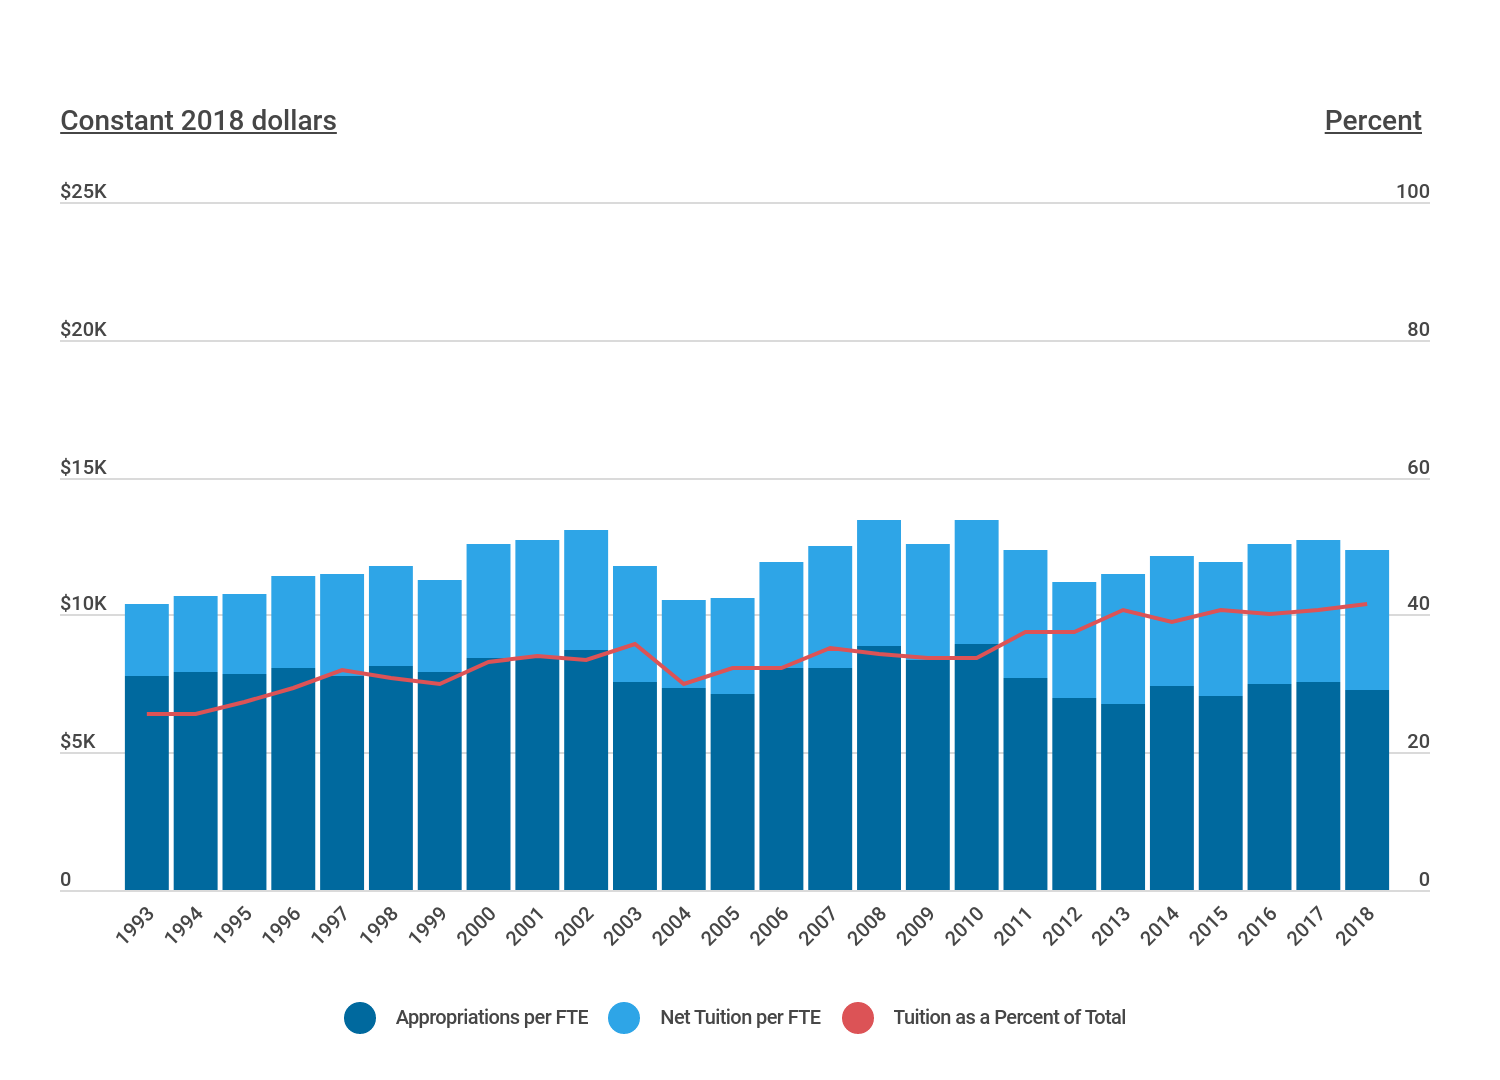
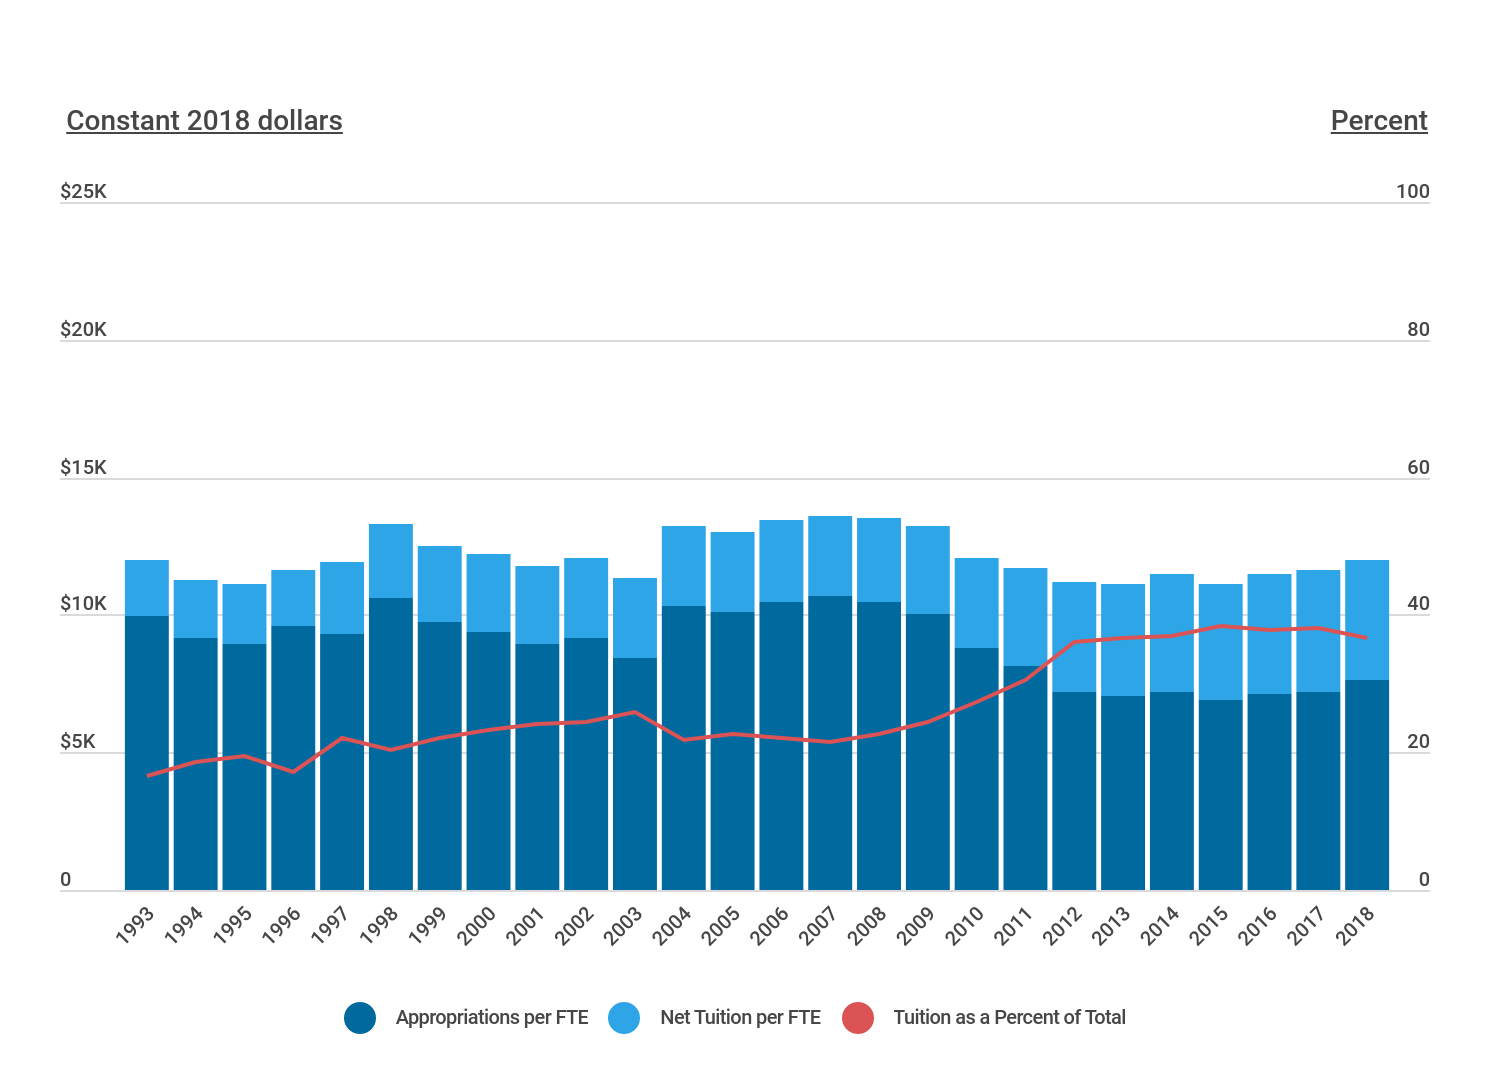
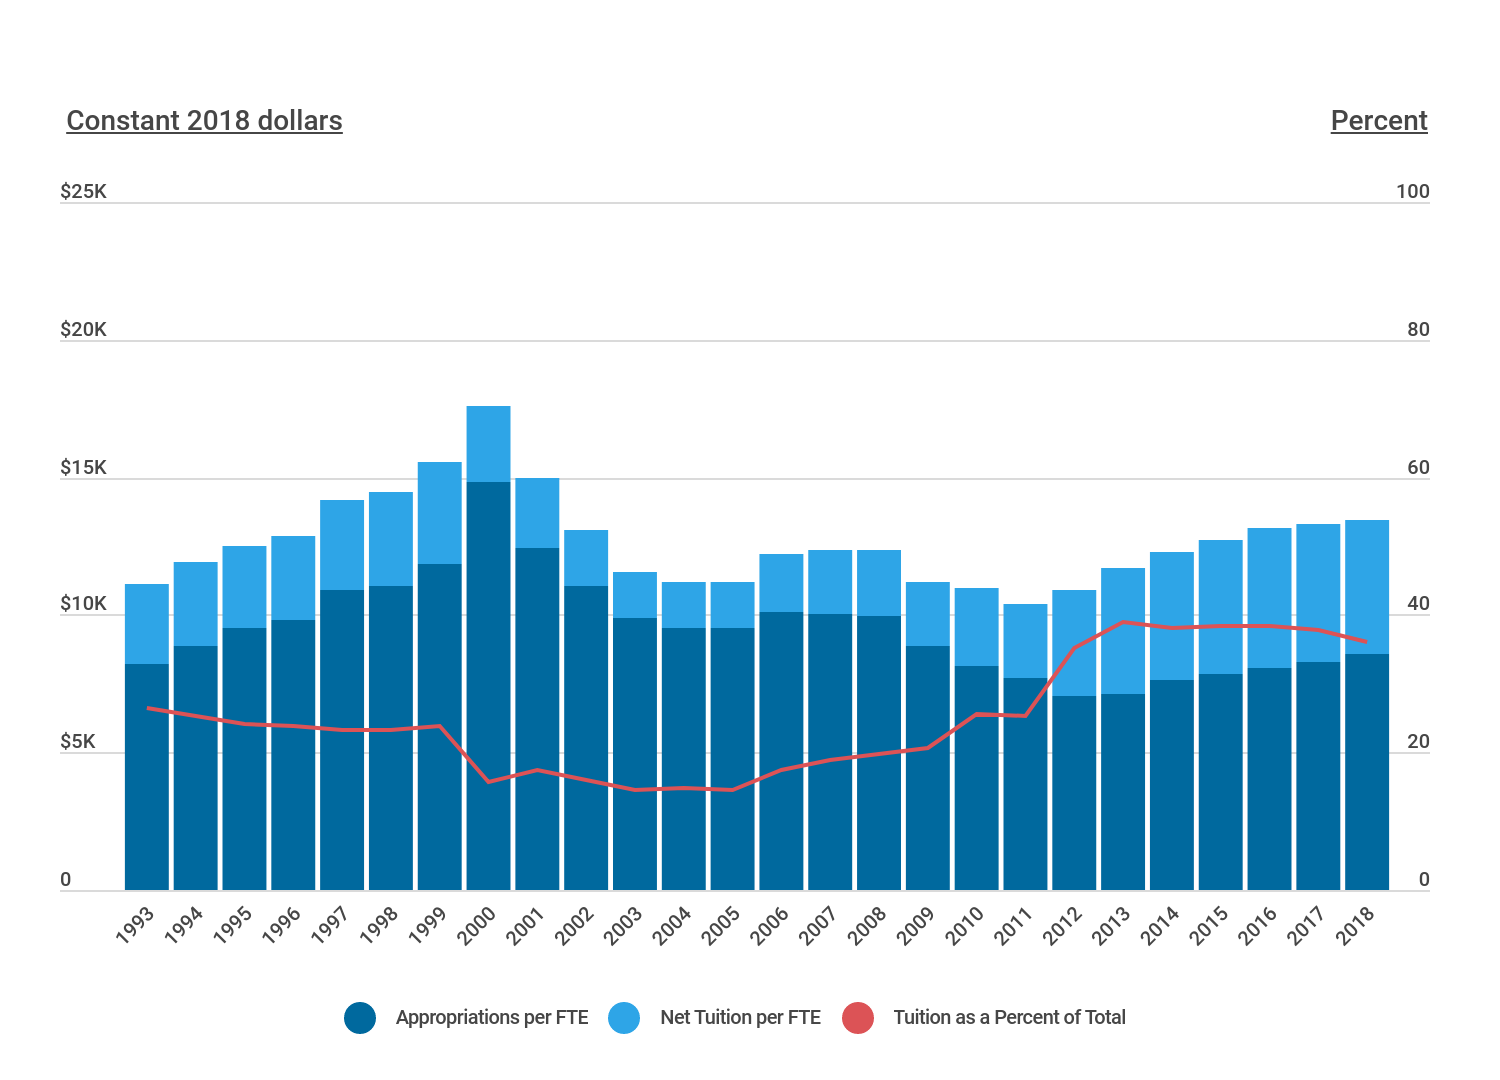
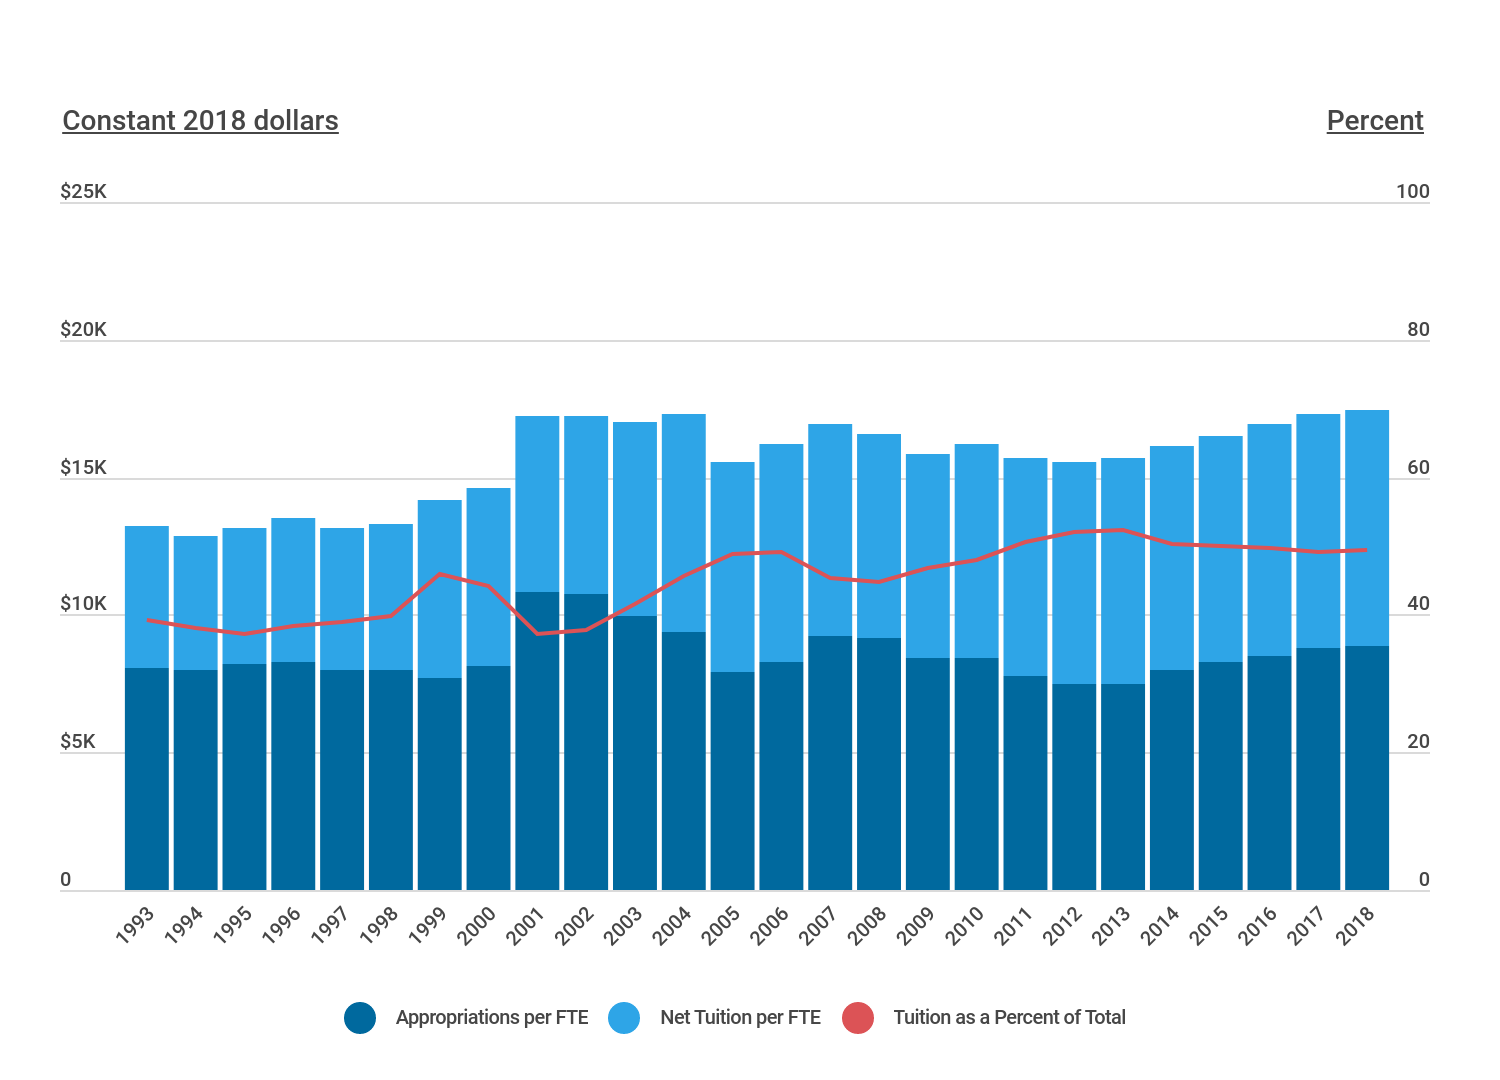
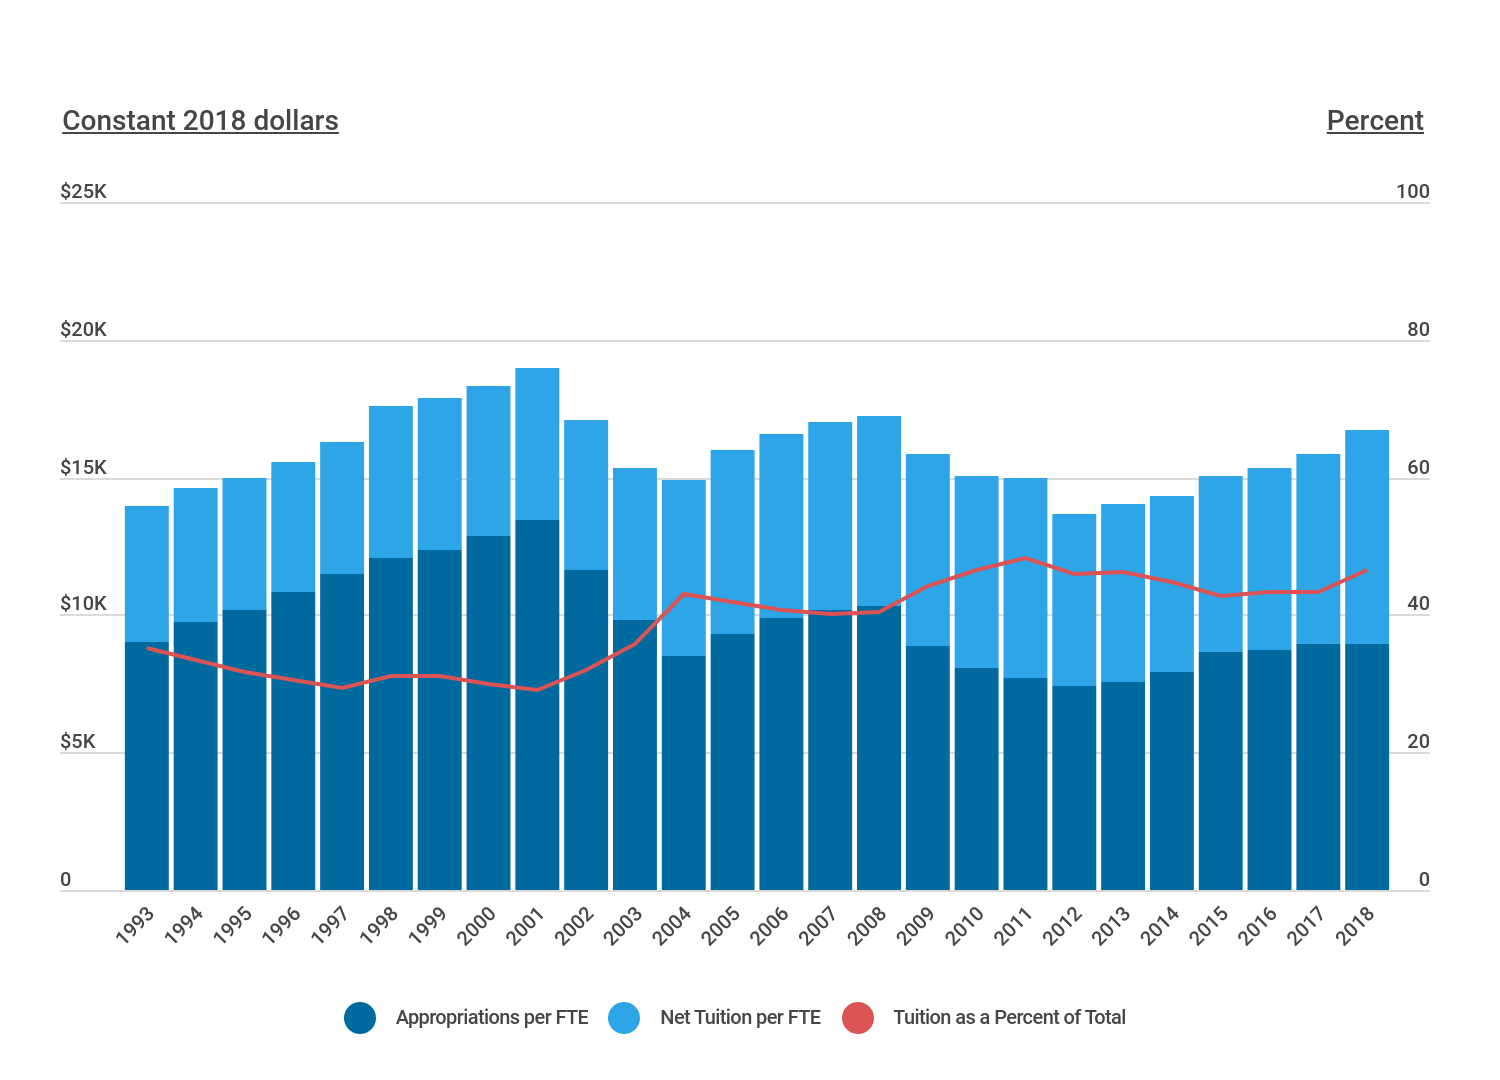
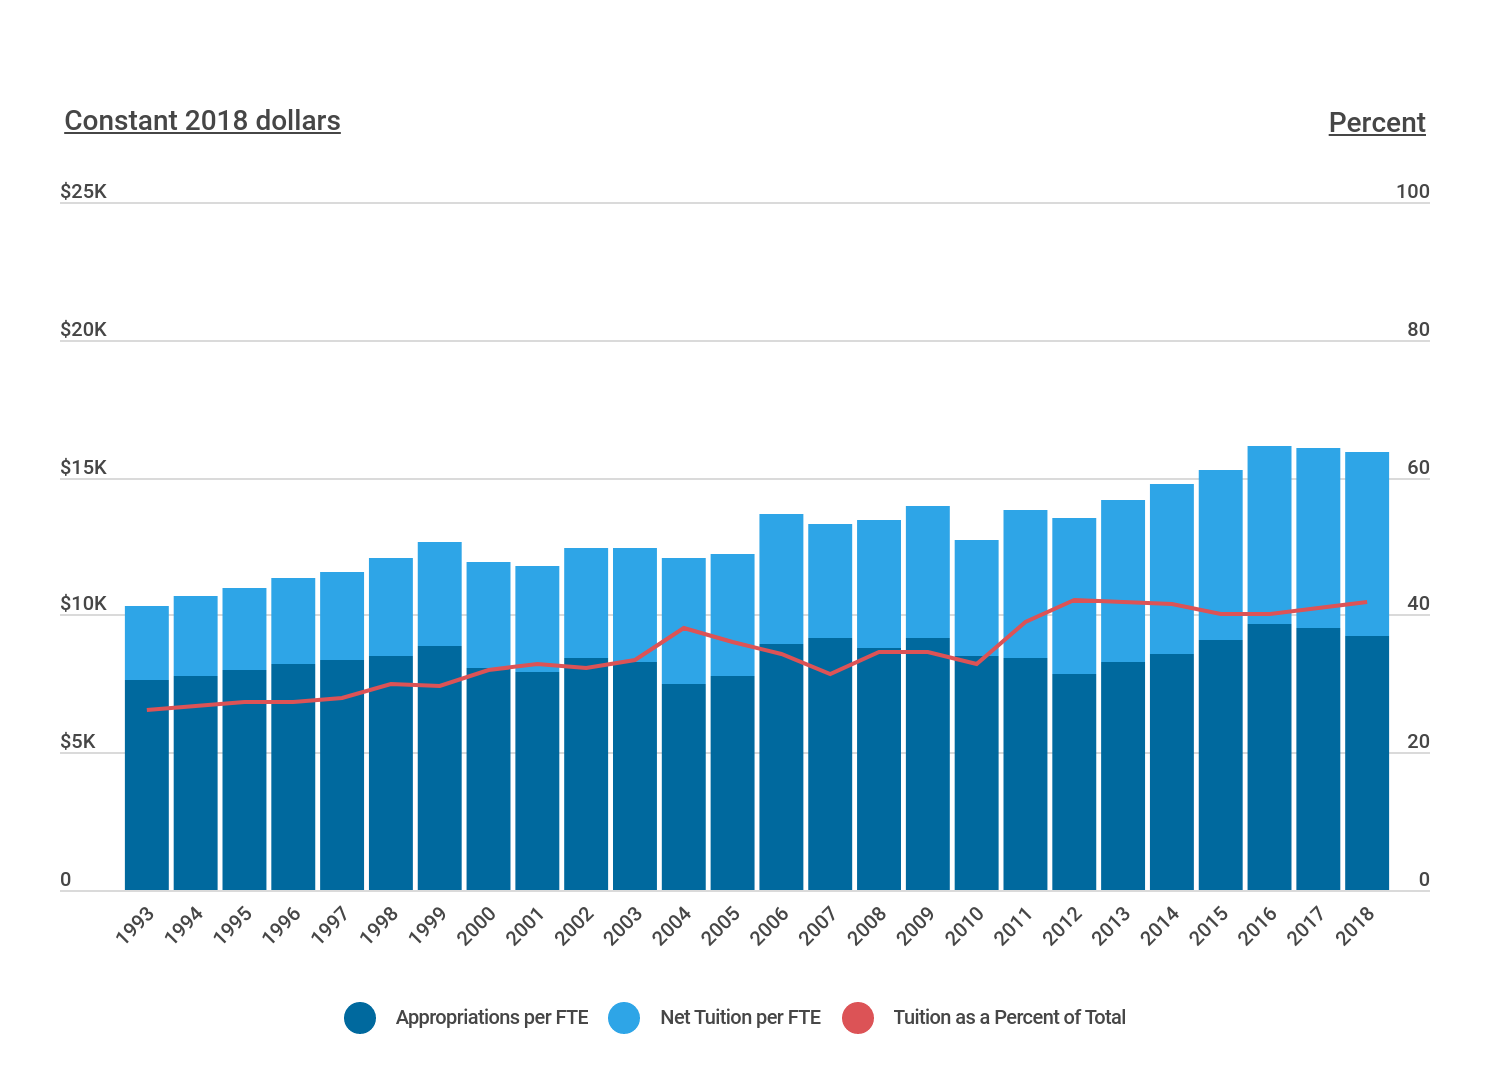
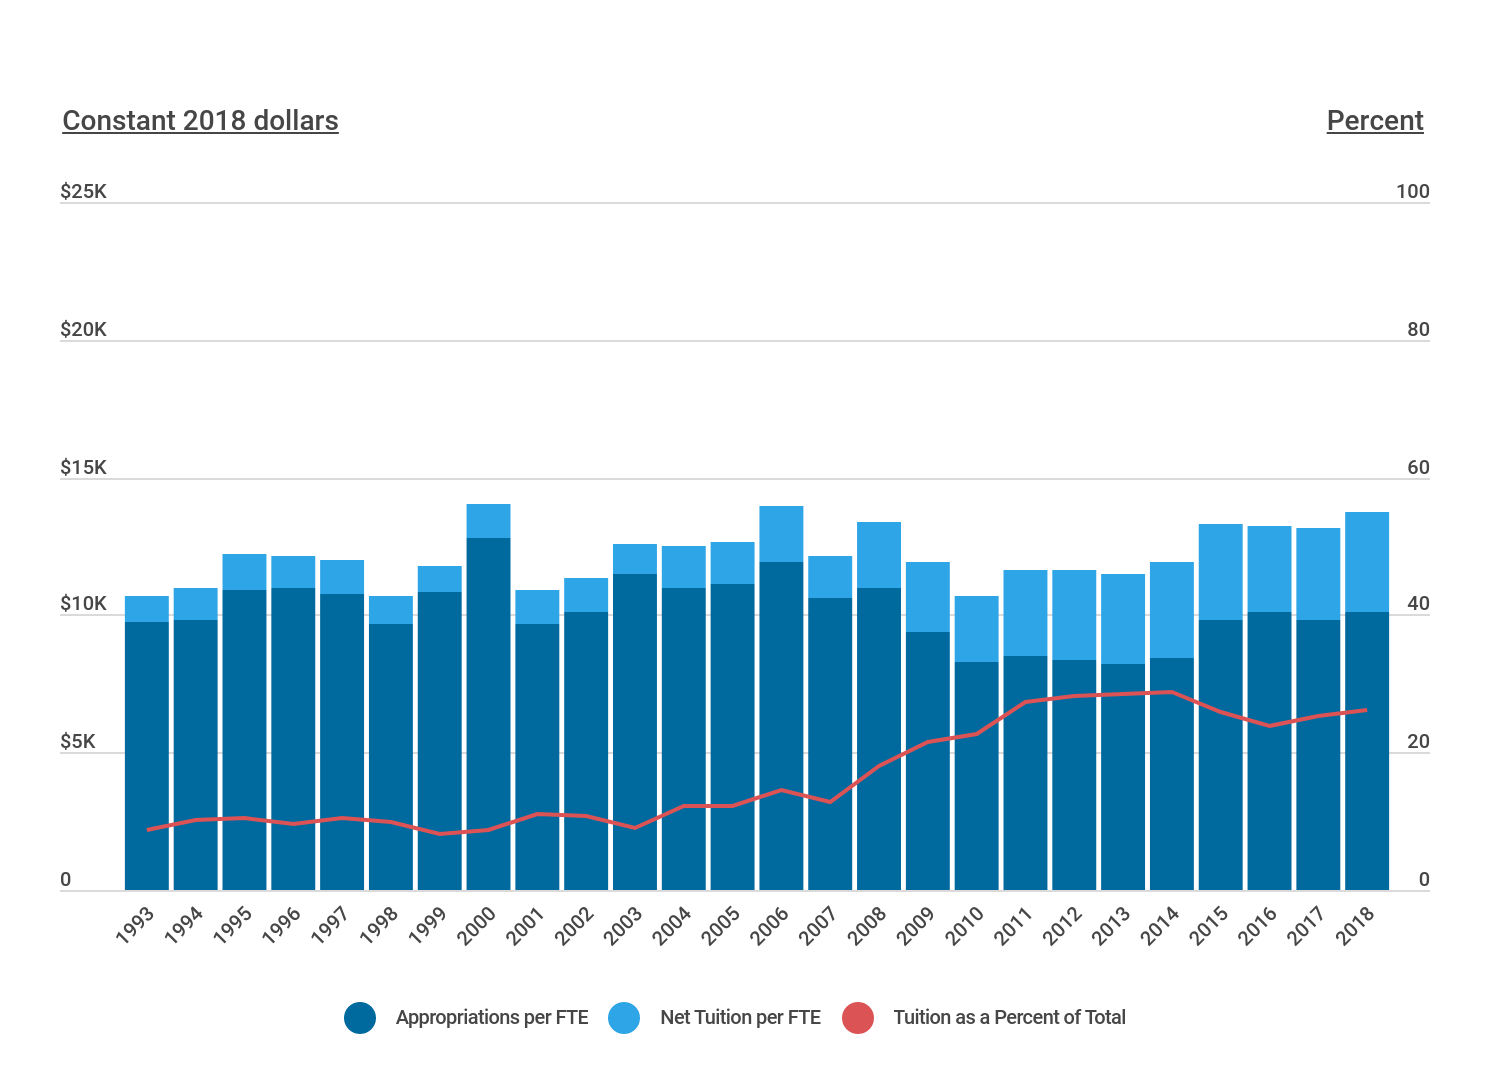
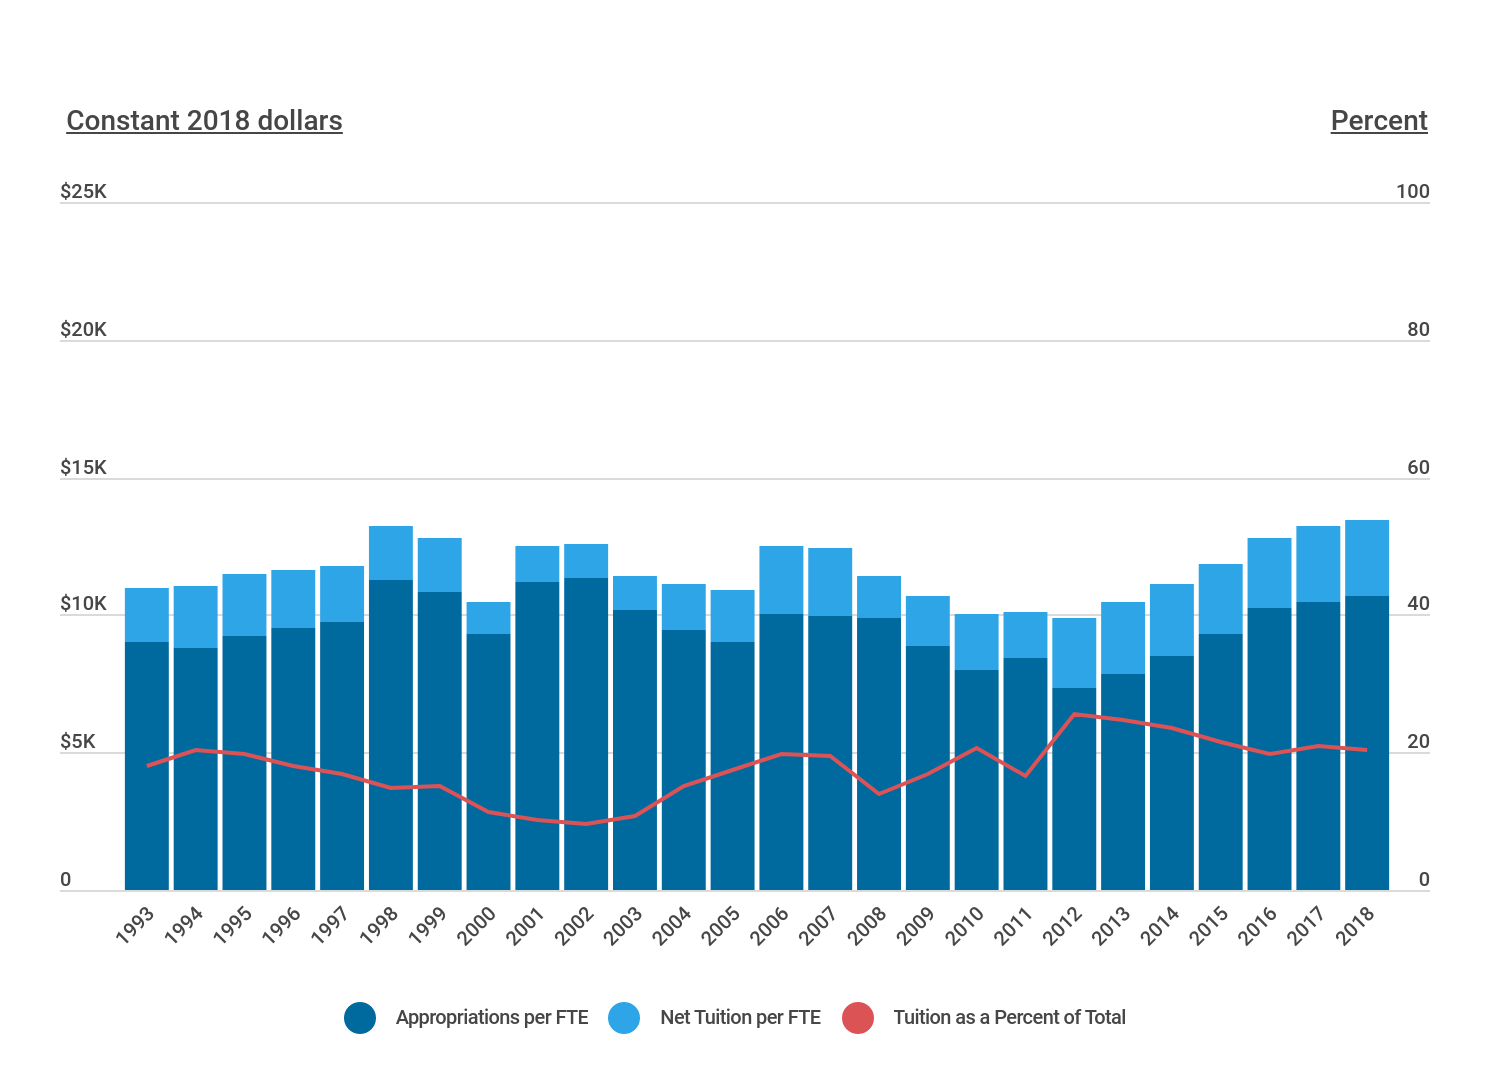
According to the State Higher Education Finance FY18 report released by the State Higher Education Executive Officers Association (SHEEO), total educational revenue per student (the sum of educational appropriations and net tuition revenue) reached its highest point in 2018. However, a closer look reveals that net tuition revenue per student (adjusted for inflation) has been increasing as a percentage of educational revenue while educational appropriations have been decreasing. Two major factors have contributed to this trend nationwide: the Great Recession and changes in the number of students participating in higher education—referred to as full-time equivalent enrollment (FTE).
“Although this reallocation of state spending away from higher education is a long-term trend, the data are punctuated by recessions in which state finances, which are subject to balanced budget constraints, undergo substantial retrenchment,” according to the American Council on Education report.
Adjusted for inflation, educational appropriations per FTE peaked in 2001 at $9,765 then dropped to $8,848 in 2008 at the onset of the Great Recession. From there, educational appropriations per FTE declined even further to $6,689 in 2012 as state funding failed to keep pace with increases in enrollment during the recession period.
The American Council on Education highlights the consequences of scaling back support for public institutions by citing changes in the college ranking landscape: “In the inaugural edition of the U.S. News & World Report college ranking that came out in 1987, eight public universities were in the top 25 national universities. Two were in the top 10.” Today, there are none in the top 10 and only three in the top 25.
Tuition revenue on the rise
According to Senior Policy Analyst Sophia Laderman at SHEEO, “The decline in state and local funding for higher education is the largest factor in tuition increases and increased reliance on tuition revenue. Since the Great Recession, almost half of the increase in tuition and fees can be explained by reductions in state and local funding.”
Since 2008, net tuition revenue per FTE rose by 39 percent. Whereas in 2008, tuition revenue made up just 36 percent of total revenue per student, in 2018 that number was 46 percent.
The SHEEO report notes that even though 10 years have passed since the Great Recession and enrollment appears to be stabilizing, state funding for higher education has only partially recovered. According to its report, only nine states have met pre-recession appropriation levels.
While all states increased their tuition revenues since 2008, tuition per FTE increases have varied from 1.2 percent in Missouri to 96.3 percent in Georgia. The wide variance in tuition increases and tuition proportions demonstrate stark differences among the states with regard to who ultimately bears the cost burden of higher education, which has consequences.
“The cost shift from states to students has happened over a period when many families have had trouble absorbing additional expenses due to stagnant or declining incomes,” explained the Center on Budget and Policy Priorities in Unkept Promises: State Cuts to Higher Education Threaten Access and Equity.
Lademan emphasized, “A shift toward tuition-dependency means that students have a higher probability of having student loan debt, higher debt balances, lower credit scores, and a lesser chance of owning a home. These effects follow students for decades after graduation.”
To find which states invest the most in higher education and how the Great Recession has affected funding, HeyTutor analyzed data from the SHEEO report to determine each state’s educational appropriations (state & local support) per FTE compared to tuition revenue per FTE. The results provide insight—not necessarily into the quality of education in each state—but rather who is largely footing the bill for higher ed (students and their families or the state). Here’s what they found.
TRENDING ON HEYTUTOR
Thinking about college applications? Consider preparing with an SAT tutor and ACT tutor. Our tutors will help you improve your scores and feel confident on test day. We also offer tutors for our higher education exams as well, such as; LSAT tutoring, MCAT tutoring, GRE tutoring, GMAT tutoring
States investing the most in their students
50. New Hampshire
-
State & local support per FTE: $3,065 (-28.4% since 2008)
-
Net tuition revenue per FTE: $11,217 (+9.4% since 2008)
-
Tution percentage of total education revenue: 78.5%
-
Total FTE enrollment: 37,643 (+14.1% since 2008)

49. Vermont
-
State & local support per FTE: $3,193 (-16.9% since 2008)
-
Net tuition revenue per FTE: $16,727 (+12.8% since 2008)
-
Tution percentage of total education revenue: 87.0%
-
Total FTE enrollment: 20,713 (+4.2% since 2008)

48. Colorado
-
State & local support per FTE: $4,479 (-11.1% since 2008)
-
Net tuition revenue per FTE: $10,908 (+63.3% since 2008)
-
Tution percentage of total education revenue: 70.9%
-
Total FTE enrollment: 183,875 (+11.7% since 2008)

47. Pennsylvania
-
State & local support per FTE: $4,552 (-35.2% since 2008)
-
Net tuition revenue per FTE: $12,113 (+29.7% since 2008)
-
Tution percentage of total education revenue: 72.7%
-
Total FTE enrollment: 344,704 (+0.5% since 2008)

46. West Virginia
-
State & local support per FTE: $4,712 (-33.6% since 2008)
-
Net tuition revenue per FTE: $7,450 (+42.2% since 2008)
-
Tution percentage of total education revenue: 65.2%
-
Total FTE enrollment: 68,746 (-6.5% since 2008)
45. Mississippi
-
State & local support per FTE: $5,301 (-32.7% since 2008)
-
Net tuition revenue per FTE: $6,284 (+36.1% since 2008)
-
Tution percentage of total education revenue: 54.2%
-
Total FTE enrollment: 130,279 (+10.8% since 2008)

44. Arizona
-
State & local support per FTE: $5,326 (-40.8% since 2008)
-
Net tuition revenue per FTE: $8,211 (+66.4% since 2008)
-
Tution percentage of total education revenue: 62.1%
-
Total FTE enrollment: 290,816 (+24.7% since 2008)

43. Louisiana
-
State & local support per FTE: $5,339 (-39.7% since 2008)
-
Net tuition revenue per FTE: $4,853 (+84.7% since 2008)
-
Tution percentage of total education revenue: 47.6%
-
Total FTE enrollment: 161,670 (-2.2% since 2008)
42. Oklahoma
-
State & local support per FTE: $5,542 (-35.9% since 2008)
-
Net tuition revenue per FTE: $6,514 (+63.5% since 2008)
-
Tution percentage of total education revenue: 54.0%
-
Total FTE enrollment: 131,083 (-0.1% since 2008)

41. Ohio
-
State & local support per FTE: $5,698 (-9.4% since 2008)
-
Net tuition revenue per FTE: $8,163 (+12.0% since 2008)
-
Tution percentage of total education revenue: 58.9%
-
Total FTE enrollment: 387,109 (+3.0% since 2008)

TRENDING ON HEYTUTOR
We offer awesome tutors within the Science field. Services include; Physics tutoring, Biology tutoring, Chemistry tutoring and more! Interested in learning more about Math? Look into linking up with a Calculus tutor, Statistics tutor, Trigonometry tutor, Algebra tutor, and Geometry tutors.
40. South Dakota
-
State & local support per FTE: $5,699 (-12.8% since 2008)
-
Net tuition revenue per FTE: $9,037 (+45.3% since 2008)
-
Tution percentage of total education revenue: 65.9%
-
Total FTE enrollment: 32,899 (+11.2% since 2008)
TRENDING ON HEYTUTOR
It can be a challenge to find a good tutor. HeyTutor provides families with a network of online and local tutors that are subject experts. Search through our physics tutors, math tutors, and english tutors.

39. Virginia
-
State & local support per FTE: $5,701 (-18.7% since 2008)
-
Net tuition revenue per FTE: $9,720 (+52.7% since 2008)
-
Tution percentage of total education revenue: 63.4%
-
Total FTE enrollment: 303,300 (+7.6% since 2008)

38. Alabama
-
State & local support per FTE: $5,758 (-37.0% since 2008)
-
Net tuition revenue per FTE: $10,921 (+75.7% since 2008)
-
Tution percentage of total education revenue: 68.4%
-
Total FTE enrollment: 202,189 (+8.1% since 2008)

37. Iowa
-
State & local support per FTE: $5,768 (-25.0% since 2008)
-
Net tuition revenue per FTE: $9,782 (+36.4% since 2008)
-
Tution percentage of total education revenue: 62.9%
-
Total FTE enrollment: 125,333 (+9.0% since 2008)

36. South Carolina
-
State & local support per FTE: $5,840 (-23.5% since 2008)
-
Net tuition revenue per FTE: $10,776 (+64.0% since 2008)
-
Tution percentage of total education revenue: 68.4%
-
Total FTE enrollment: 164,402 (+9.9% since 2008)
35. Montana
-
State & local support per FTE: $5,879 (-1.4% since 2008)
-
Net tuition revenue per FTE: $6,834 (+16.6% since 2008)
-
Tution percentage of total education revenue: 53.8%
-
Total FTE enrollment: 37,371 (+5.1% since 2008)

34. Missouri
-
State & local support per FTE: $5,911 (-25.7% since 2008)
-
Net tuition revenue per FTE: $5,542 (+1.2% since 2008)
-
Tution percentage of total education revenue: 48.4%
-
Total FTE enrollment: 186,862 (+13.8% since 2008)

33. Michigan
-
State & local support per FTE: $6,150 (-14.3% since 2008)
-
Net tuition revenue per FTE: $14,288 (+49.7% since 2008)
-
Tution percentage of total education revenue: 69.9%
-
Total FTE enrollment: 372,155 (-5.8% since 2008)
32. Wisconsin
-
State & local support per FTE: $6,189 (-22.2% since 2008)
-
Net tuition revenue per FTE: $6,307 (+34.2% since 2008)
-
Tution percentage of total education revenue: 50.5%
-
Total FTE enrollment: 211,610 (-3.4% since 2008)

31. Delaware
-
State & local support per FTE: $6,300 (-27.3% since 2008)
-
Net tuition revenue per FTE: $18,941 (+41.8% since 2008)
-
Tution percentage of total education revenue: 75.8%
-
Total FTE enrollment: 36,073 (+14.1% since 2008)

30. Indiana
-
State & local support per FTE: $6,435 (-4.0% since 2008)
-
Net tuition revenue per FTE: $10,191 (+41.6% since 2008)
-
Tution percentage of total education revenue: 62.0%
-
Total FTE enrollment: 220,665 (-1.0% since 2008)
DID YOU KNOW?
Finding a tutor doesn’t need to be a pain. HeyTutor offers access to experienced online tutoring in as little as an hour. Otherwise, choose from a pre-screened and handpicked group of private tutors near you.

29. Rhode Island
-
State & local support per FTE: $6,477 (-11.9% since 2008)
-
Net tuition revenue per FTE: $10,216 (+26.1% since 2008)
-
Tution percentage of total education revenue: 61.2%
-
Total FTE enrollment: 30,316 (+0.7% since 2008)

28. Kansas
-
State & local support per FTE: $6,483 (-17.6% since 2008)
-
Net tuition revenue per FTE: $7,083 (+38.6% since 2008)
-
Tution percentage of total education revenue: 52.2%
-
Total FTE enrollment: 124,958 (+2.6% since 2008)
27. Arkansas
-
State & local support per FTE: $6,698 (-16.1% since 2008)
-
Net tuition revenue per FTE: $5,791 (+41.7% since 2008)
-
Tution percentage of total education revenue: 49.6%
-
Total FTE enrollment: 114,664 (+8.9% since 2008)

26. Kentucky
-
State & local support per FTE: $6,781 (-25.4% since 2008)
-
Net tuition revenue per FTE: $6,752 (+27.4% since 2008)
-
Tution percentage of total education revenue: 49.9%
-
Total FTE enrollment: 144,747 (+1.7% since 2008)

25. Oregon
-
State & local support per FTE: $6,807 (+0.1% since 2008)
-
Net tuition revenue per FTE: $9,141 (+51.9% since 2008)
-
Tution percentage of total education revenue: 57.3%
-
Total FTE enrollment: 142,723 (+10.1% since 2008)

24. New Jersey
-
State & local support per FTE: $7,018 (-27.0% since 2008)
-
Net tuition revenue per FTE: $10,485 (+29.1% since 2008)
-
Tution percentage of total education revenue: 59.9%
-
Total FTE enrollment: 264,441 (+11.1% since 2008)

23. Florida
-
State & local support per FTE: $7,207 (-16.9% since 2008)
-
Net tuition revenue per FTE: $2,830 (+20.6% since 2008)
-
Tution percentage of total education revenue: 28.2%
-
Total FTE enrollment: 602,675 (+11.4% since 2008)

22. Utah
-
State & local support per FTE: $7,208 (-16.2% since 2008)
-
Net tuition revenue per FTE: $6,200 (+43.2% since 2008)
-
Tution percentage of total education revenue: 46.2%
-
Total FTE enrollment: 125,550 (+21.5% since 2008)
21. Texas
-
State & local support per FTE: $7,232 (-18.2% since 2008)
-
Net tuition revenue per FTE: $5,143 (+12.1% since 2008)
-
Tution percentage of total education revenue: 41.6%
-
Total FTE enrollment: 1,052,885 (+30.8% since 2008)

20. Minnesota
-
State & local support per FTE: $7,363 (-8.1% since 2008)
-
Net tuition revenue per FTE: $8,873 (+42.1% since 2008)
-
Tution percentage of total education revenue: 54.6%
-
Total FTE enrollment: 187,705 (-4.2% since 2008)

19. Washington
-
State & local support per FTE: $7,421 (-13.3% since 2008)
-
Net tuition revenue per FTE: $5,791 (+58.8% since 2008)
-
Tution percentage of total education revenue: 43.8%
-
Total FTE enrollment: 237,289 (+7.2% since 2008)
18. Nevada
-
State & local support per FTE: $7,600 (-27.6% since 2008)
-
Net tuition revenue per FTE: $4,361 (+42.7% since 2008)
-
Tution percentage of total education revenue: 36.5%
-
Total FTE enrollment: 70,450 (+11.3% since 2008)

17. Tennessee
-
State & local support per FTE: $7,723 (-14.1% since 2008)
-
Net tuition revenue per FTE: $6,278 (+46.9% since 2008)
-
Tution percentage of total education revenue: 45.6%
-
Total FTE enrollment: 184,976 (+6.5% since 2008)

16. Maine
-
State & local support per FTE: $7,866 (-2.5% since 2008)
-
Net tuition revenue per FTE: $9,863 (+22.8% since 2008)
-
Tution percentage of total education revenue: 55.6%
-
Total FTE enrollment: 33,945 (-4.5% since 2008)

15. North Dakota
-
State & local support per FTE: $7,941 (+15.2% since 2008)
-
Net tuition revenue per FTE: $8,637 (+17.6% since 2008)
-
Tution percentage of total education revenue: 52.1%
-
Total FTE enrollment: 34,963 (no change since 2008)

14. Idaho
-
State & local support per FTE: $8,513 (-18.8% since 2008)
-
Net tuition revenue per FTE: $3,854 (+52.8% since 2008)
-
Tution percentage of total education revenue: 31.2%
-
Total FTE enrollment: 53,570 (+21.8% since 2008)
13. Georgia
-
State & local support per FTE: $8,574 (-13.6% since 2008)
-
Net tuition revenue per FTE: $4,839 (+96.3% since 2008)
-
Tution percentage of total education revenue: 36.1%
-
Total FTE enrollment: 350,448 (+12.8% since 2008)
12. Maryland
-
State & local support per FTE: $8,833 (-3.4% since 2008)
-
Net tuition revenue per FTE: $8,620 (+15.6% since 2008)
-
Tution percentage of total education revenue: 49.4%
-
Total FTE enrollment: 231,777 (+11.8% since 2008)
11. Massachusetts
-
State & local support per FTE: $8,965 (-12.9% since 2008)
-
Net tuition revenue per FTE: $7,781 (+11.9% since 2008)
-
Tution percentage of total education revenue: 46.5%
-
Total FTE enrollment: 163,673 (+10.4% since 2008)

10. North Carolina
-
State & local support per FTE: $9,018 (-16.5% since 2008)
-
Net tuition revenue per FTE: $4,769 (+47.3% since 2008)
-
Tution percentage of total education revenue: 34.6%
-
Total FTE enrollment: 392,138 (+9.7% since 2008)
9. Nebraska
-
State & local support per FTE: $9,252 (+5.3% since 2008)
-
Net tuition revenue per FTE: $6,633 (+41.8% since 2008)
-
Tution percentage of total education revenue: 41.8%
-
Total FTE enrollment: 76,790 (+1.8% since 2008)

8. Connecticut
-
State & local support per FTE: $9,861 (-24.1% since 2008)
-
Net tuition revenue per FTE: $12,645 (+49.8% since 2008)
-
Tution percentage of total education revenue: 56.2%
-
Total FTE enrollment: 86,008 (+11.6% since 2008)
7. New Mexico
-
State & local support per FTE: $10,129 (-7.9% since 2008)
-
Net tuition revenue per FTE: $3,617 (+50.9% since 2008)
-
Tution percentage of total education revenue: 26.3%
-
Total FTE enrollment: 83,747 (-1.7% since 2008)
6. California
-
State & local support per FTE: $10,703 (+8.6% since 2008)
-
Net tuition revenue per FTE: $2,747 (+73.2% since 2008)
-
Tution percentage of total education revenue: 20.4%
-
Total FTE enrollment: 1,556,971 (+3.3% since 2008)

5. New York
-
State & local support per FTE: $11,135 (+4.8% since 2008)
-
Net tuition revenue per FTE: $6,188 (+35.8% since 2008)
-
Tution percentage of total education revenue: 35.7%
-
Total FTE enrollment: 545,107 (+3.5% since 2008)

4. Illinois
-
State & local support per FTE: $14,587 (+29.7% since 2008)
-
Net tuition revenue per FTE: $7,767 (+57.5% since 2008)
-
Tution percentage of total education revenue: 35.4%
-
Total FTE enrollment: 311,101 (-13.3% since 2008)

3. Wyoming
-
State & local support per FTE: $15,726 (+0.8% since 2008)
-
Net tuition revenue per FTE: $3,321 (+21.4% since 2008)
-
Tution percentage of total education revenue: 17.5%
-
Total FTE enrollment: 22,699 (-1.5% since 2008)

2. Hawaii
-
State & local support per FTE: $16,937 (+6.7% since 2008)
-
Net tuition revenue per FTE: $6,408 (+45.3% since 2008)
-
Tution percentage of total education revenue: 27.4%
-
Total FTE enrollment: 36,030 (+1.6% since 2008)

1. Alaska
-
State & local support per FTE: $17,704 (+0.5% since 2008)
-
Net tuition revenue per FTE: $6,821 (+15.6% since 2008)
-
Tution percentage of total education revenue: 27.8%
-
Total FTE enrollment: 17,515 (-6.4% since 2008)
Methodology
The data used in this analysis is from the State Higher Education Executive Officers Association SHEF: FY 2018 State Higher Education Finance report. All dollar amounts and changes are inflation-adjusted to constant 2018 dollars.
“State & local support per FTE” is a measure of state and local funds for public higher education operating expenses. It excludes appropriations for independent institutions, financial aid for students attending independent institutions, research, hospitals, and medical education. The final list of states is ordered by this statistic.